Keltner Channel: peculiarities of working with the indicator
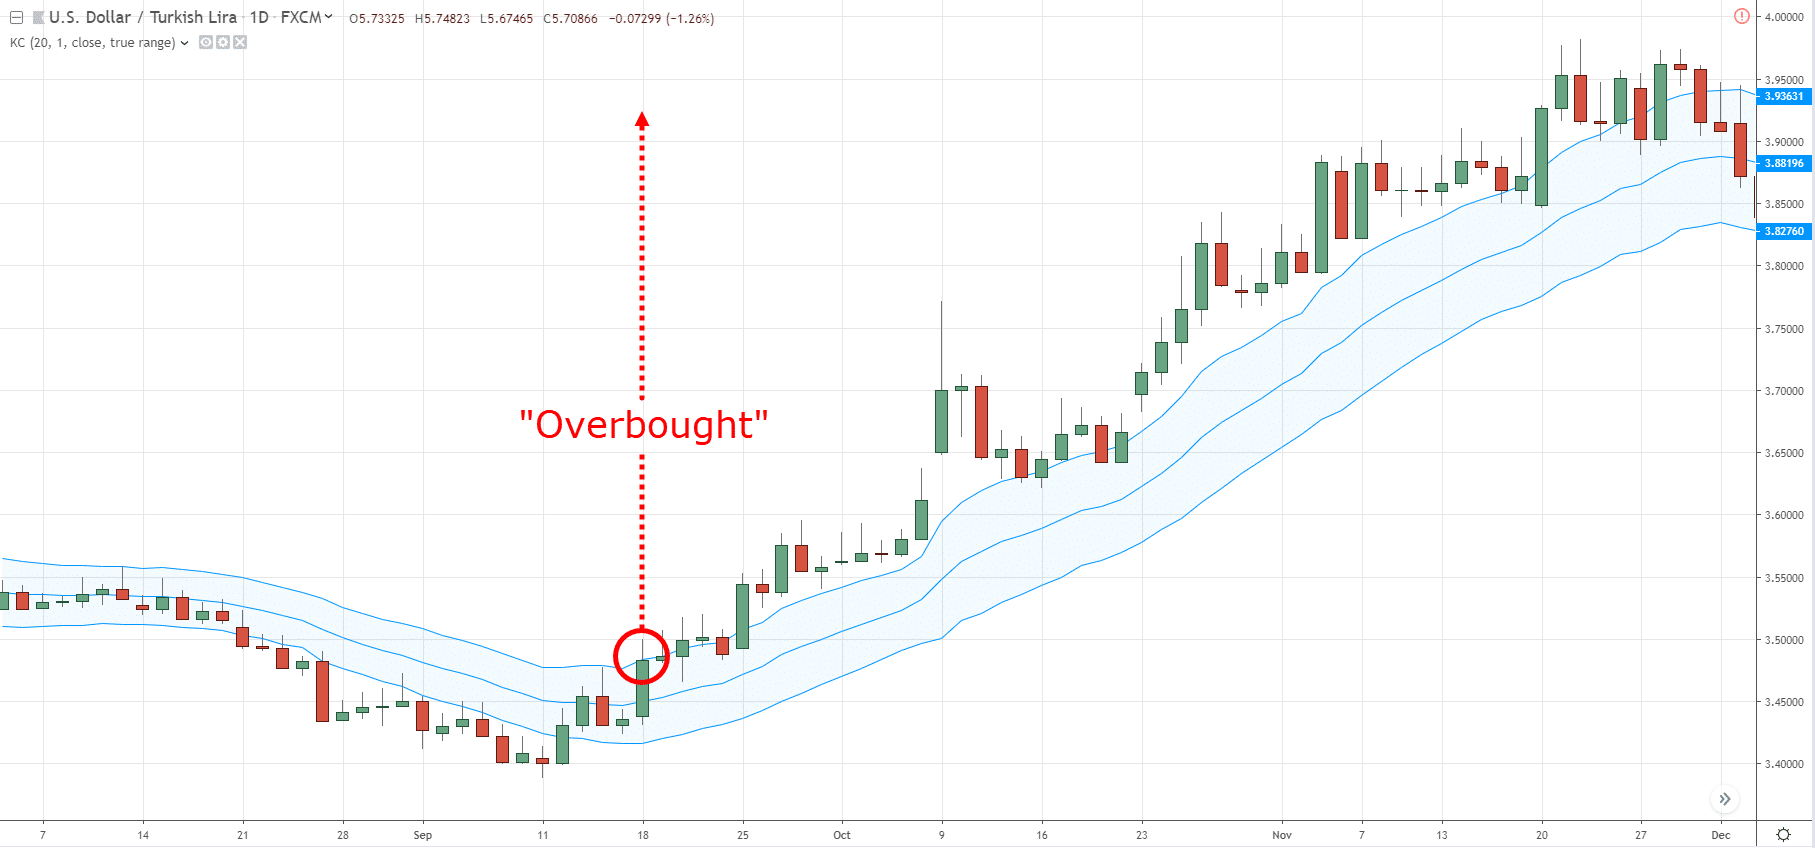
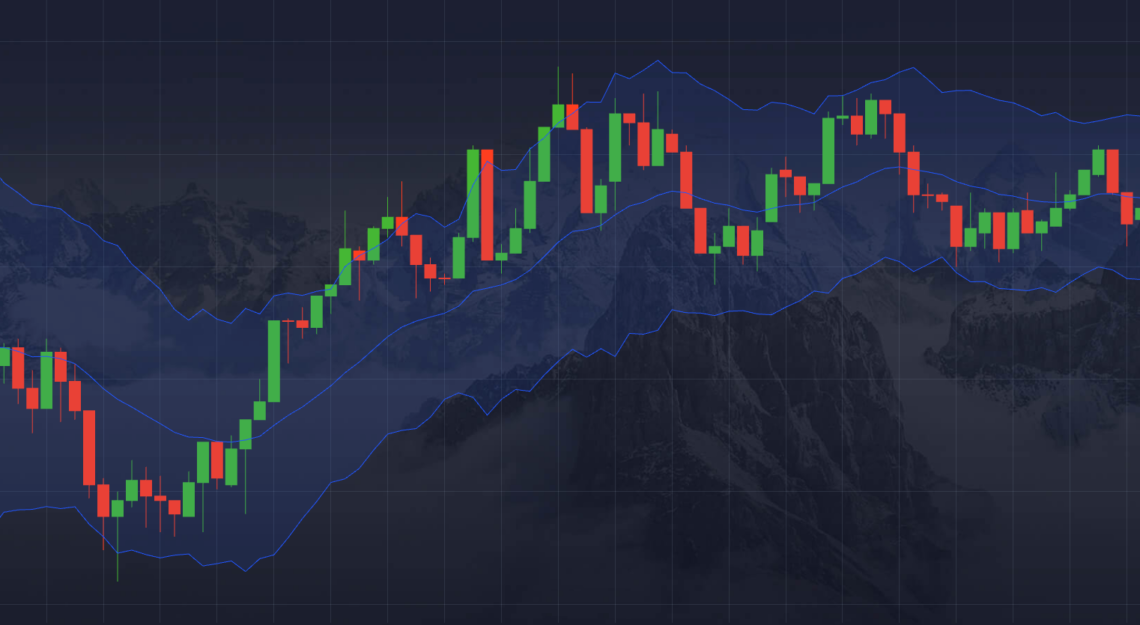
The Keltner Channel is a technical analysis tool used to determine the trend in the market. The indicator is based on tracking volatility. The channel principle is used to analyze the price movement when the upper and lower levels, within which the price will be almost the entire trading period, are visible when applied to the chart. If the indicator exceeds the marked limits, the movement will be carried out in the direction of exceeding the limit.
The Keltner indicator includes:
– the average line of the EMA type with a set period of 20, but it can be adjusted;
– ATR range, which is a boundary line multiplied by 2, the multiplier can also be changed.
You can use this indicator to track trends in the market. The onset of a bullish period is evidenced by a rise in price to the upper limit, and bearish sentiment is signaled by a fall to the lower boundary. In addition, the vector of the channel itself tells about the market dynamics.
If the price fluctuates between levels, the latter becomes resistance and support points, which can be used for trading.
The Keltner indicator was developed in 1960. And during this time, the principle of its calculation has repeatedly changed. Thus, traders have adapted the tool to their needs and the peculiarities of the markets. The generally accepted formula uses a period of 10 or 20 for the EMA. The ATR for a particular period is multiplied by a specific value, usually 1.5 or 2. The resulting ATR is added to the EMA – this is the upper limit. The lower level is determined by subtracting the ATR from the EMA. Thanks to the channel, you can determine the entry points that allow you to trade the asset with minimal risk. If the price breaks through the levels, there is a chance of a return. However, this possibility has yet to be realized in the case of a strong trend. At the same time, the return may occur later and when the price will be within other limits. The Keltner indicator is designed so that the cost rarely exceeds the levels. The trading signal in a flat is the price movement within the specified levels and without a slope angle.
The channel may become a great assistant for a trader, but it is vital to be able to read its signals correctly. The indicator points out the peculiarities of the trend and the probability of its continuation for some time. In addition, the tool determines the beginning of a correction and signals the market condition. It is important to understand that the accuracy of the channel analysis depends, first of all, on the settings. The trader should clearly understand the purpose of using the indicator. And then, it is possible to start making the necessary changes.


