
Harmonic patterns: peculiarities of construction
Harmonic patterns are one of the modifications of the classical variants in technical analysis. They use Fibonacci proportions to mark points for reversals. Such patterns combine mathematical and graphical elements, making the tools highly accurate. With the help of harmonic patterns, it is possible to predict the direction of the price movement, as well as to identify the anticipated goals of these dynamics.
An important feature of this tool is the number of false signals, there are fewer of them compared with other models. The matter is that for harmonious patterns it is necessary to develop exclusively in correct proportions. In addition, graphic patterns can be superimposed on them, and for the analysis to be as accurate as possible, it is better to conduct it on several timeframes. This will give a better understanding of the processes that occur in the market.
Rules used in the construction of this type of patterns:
– the tool is interconnected with the main Fibonacci levels for entering the market;
– the patterns are relevant for all timeframes;
– it is important to know the coordinates of points A, B, C, and X, which can be found in the history of the chart. They allow us to determine the type and the characteristics of the pattern;
– the most common variant of the model – is XABCD, where X represents the beginning of the trend and A – its peak point. B is used to indicate the maximum or minimum of the correction.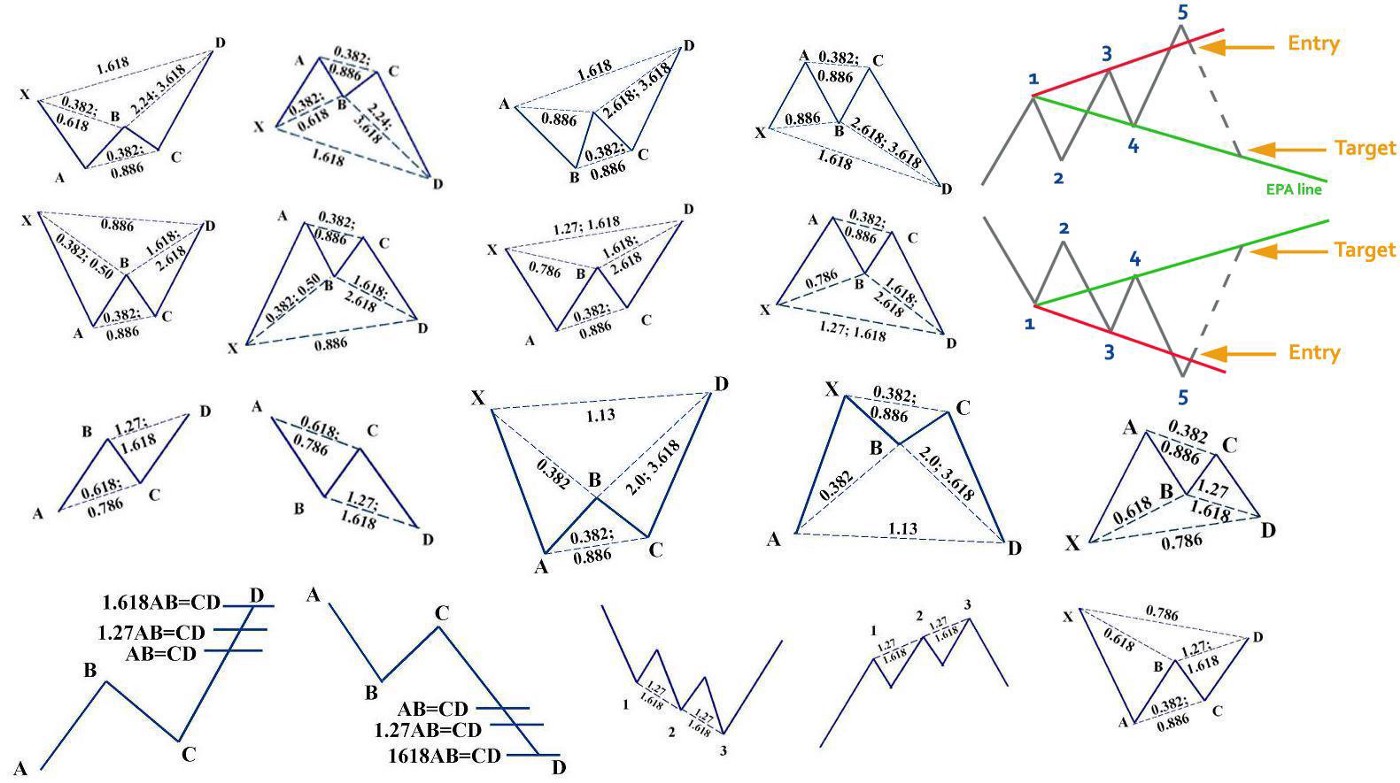
There are different variants of this type of pattern, popular are Shark, Butterfly, and Crab. At first glance, they are very difficult to distinguish, but upon further study the difference is noticeable. The two main groups here are bear patterns and bull patterns. What all types have in common is the wave structure, with A and C indicating extrema. However, for a bullish chart, these points move upwards, while for a bearish chart they indicate lows. At the same time, the pattern always has clear impulse proportions.
The first thing with which to start constructing such a chart is to identify the so-called double bottom, which is the basis for analysis. Next, it is necessary to understand what type of the given pattern belongs to. After identifying the four zones, which will help to find entry points. When opening positions it is necessary to pay attention to the time zones and angles of descents and ascents.
Any harmonic pattern has clearly traceable points, which can potentially indicate its end. The Fibonacci levels are used for this purpose. The area of permissible losses, which lies outside the pivot level, is also taken into consideration. In this case, the trader understands that the pattern has not given the desired result, and it is important to minimize the losses. The breakeven point should be established initially to protect oneself from large losses.