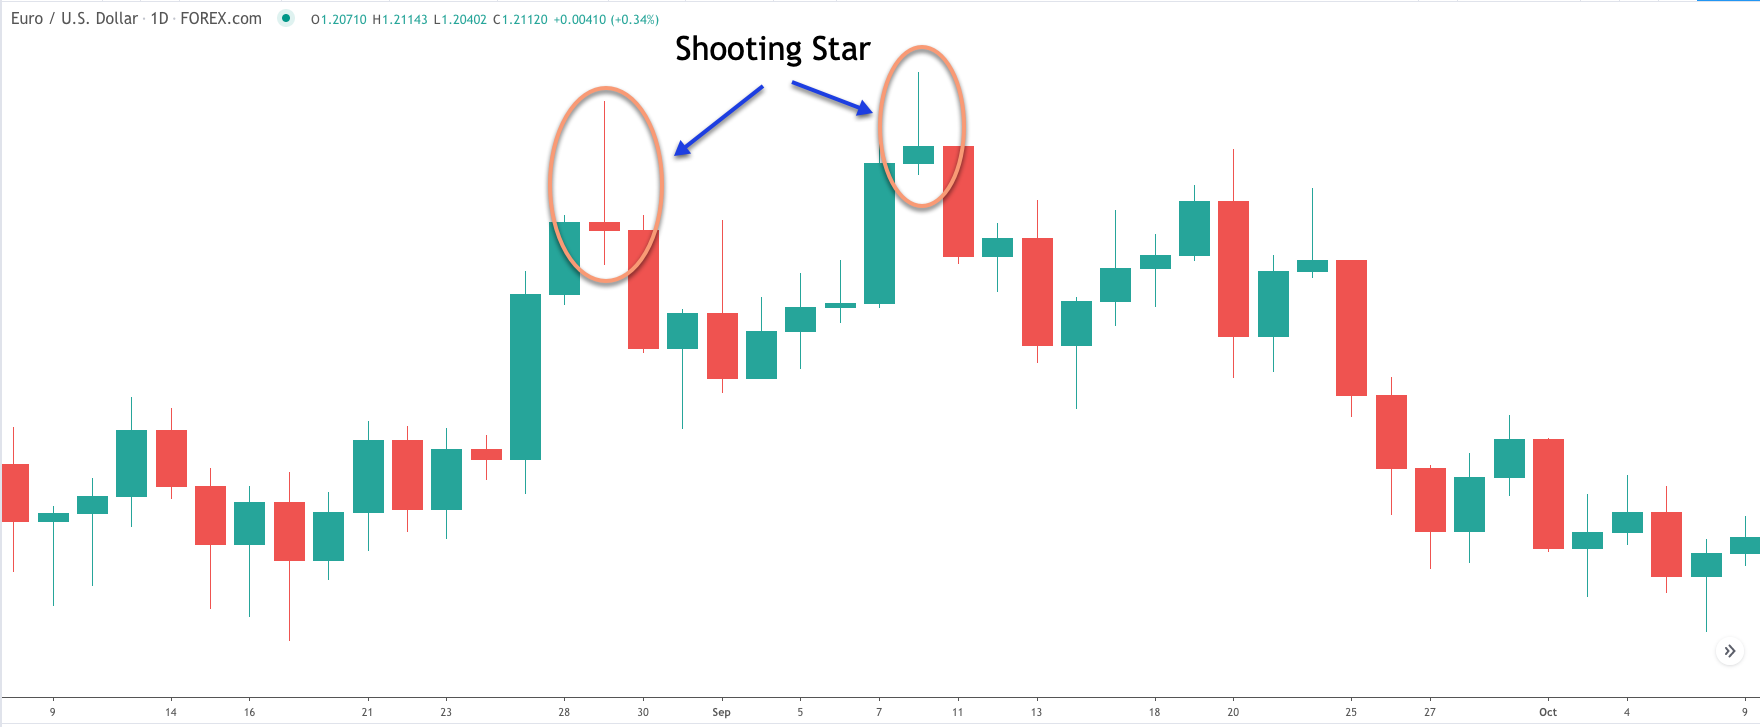
What information the shooting star pattern carries
The shooting star pattern is represented by two candles, which in most cases are on top. However, there are variants, when the pattern is formed during the upward dynamics.
The lower part of the candle in this case has a small body, and the upper shadow is elongated. This shape of the shadow shows that it has reached a peak on the price chart. Seeing the “shooting star,” the trader will be able to clearly identify resistance points and the most profitable areas to enter the market. However, it should be understood that the pattern for a bearish trend is not always true, so it should be additionally checked with other patterns. The color does not play a big role here, in this case, we can see that at the opening of the session the price was going up, but at the closing, the price went down and returned to the opening point. In simple words, the closing and opening prices are close to each other, which confirms the presence of the long shadow.
A bullish “shooting star” is a stronger signal than a bearish one. When it appears, there is a high probability that we should expect a correction soon. In the case of a bullish trend, the pattern has only one star, which is formed from the bottom. The pattern appears when the price was at a strong support level, where the pending buy orders are already located. Advantages of the pattern:
– the figure is easy to identify;
– suitable for beginners, as it is rarely difficult to work with the figure;
– when complemented by other reversal patterns is considered a reliable signal.
Disadvantages of the “shooting star”:
– can give false signals, requires checking for upward dynamics;
– better to use in combination with other indicators.
To use a pattern for trading, it is important to follow a number of rules. The first thing to start with is to designate support and resistance levels. In case the trader is using a conservative trading strategy, it is necessary to wait until there is a support breakout. This signals that the price has demonstrated a reversal and it is time to take a short position. If the trader is not afraid of taking risks, it is possible to start a deal earlier – at the point of chart formation.
Next, it is necessary to determine the Stop-loss, this step will make it possible to reduce losses in case of failure. Traditionally, it is set at 500 bps higher than the position was opened.
When using the shooting star pattern, it is important not to confuse it with other patterns. One should keep in mind that in this case the formation is performed at the top and not at the bottom as in the case of the inverted hammer pattern. You don’t need to pay attention to the color, it’s better to estimate the length of the tail.


