Commodity channel index: how to work with the tool
The commodity channel index, or CCI, belongs to the traditional variants of technical analysis. It has established itself as a reliable indicator of changes in the commodity markets, as well as in combination with other financial instruments.
The main advantage of working with this index is the ease of interpreting signals and fairly simple calculation, so it is actively used by both beginners and experienced traders. The latter index is useful when searching for overbought or oversold conditions, as well as for determining additional points to enter the market.
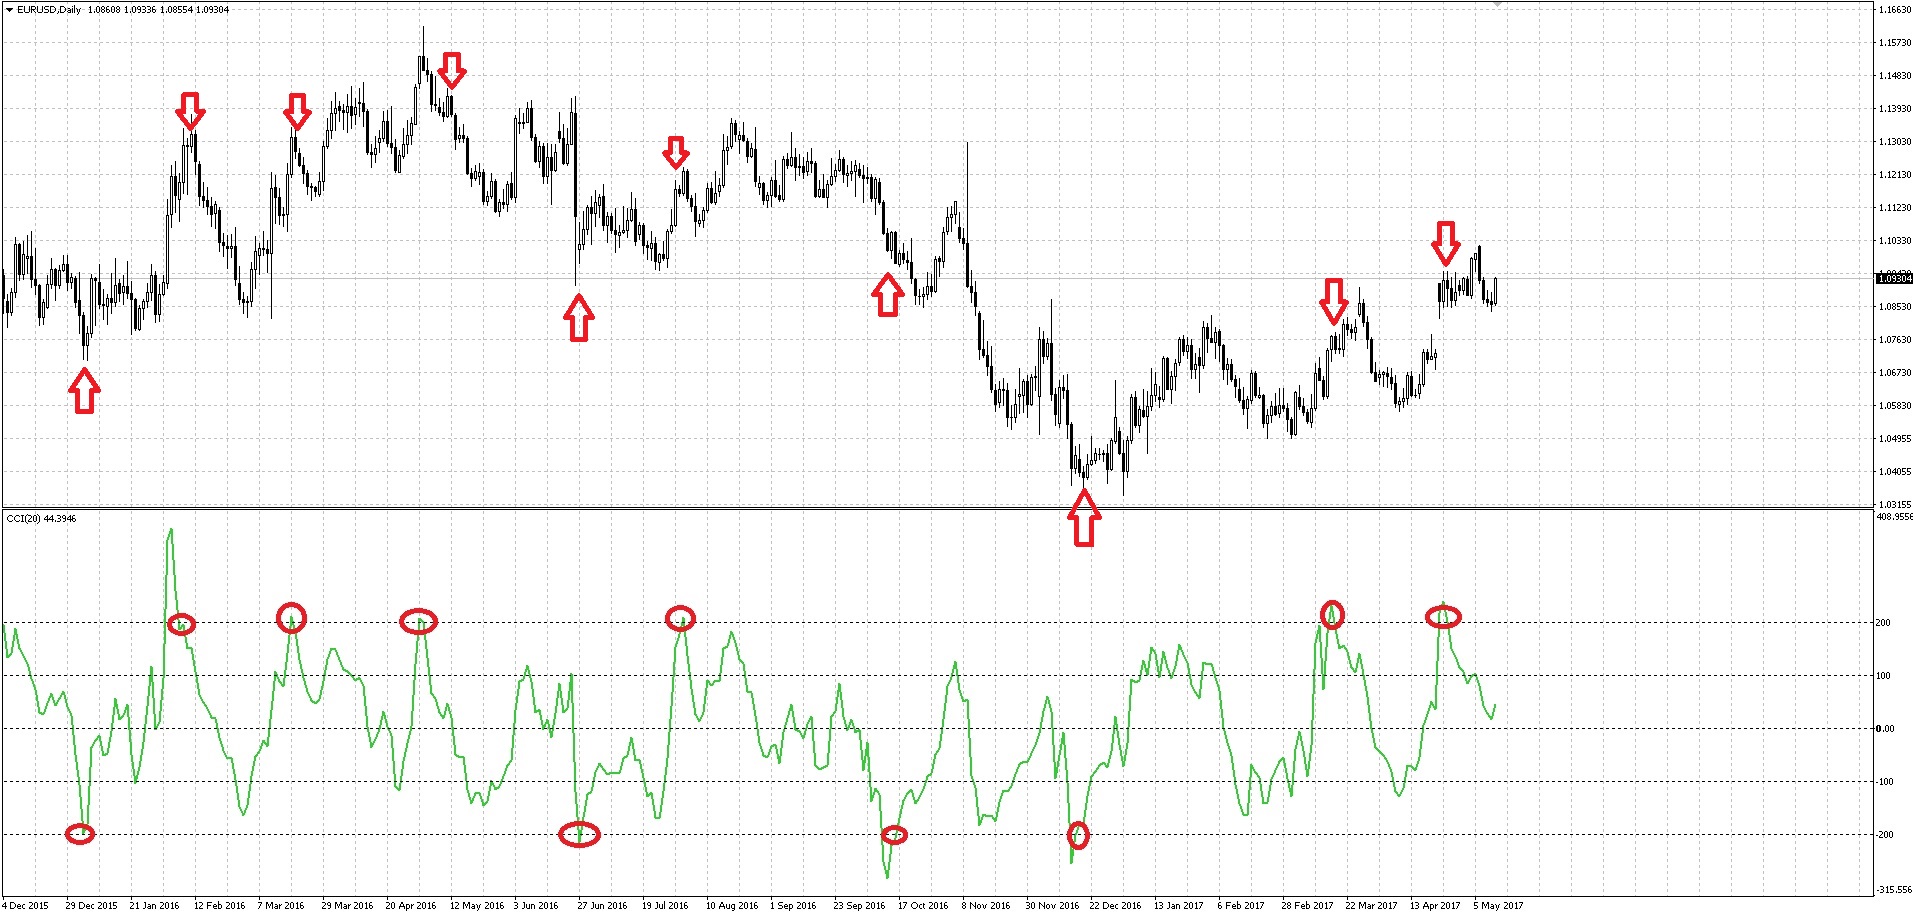
CCI belongs to the group of oscillators and in most cases this chart is located in the neutral zone, indicating that the market is calm. As soon as the chart exits this zone, the indicator signals the beginning of an impulse. In addition, the commodity channel index helps make predictions about the end of a trend or the appearance of a correction.
The signals broadcast by CCI are divided into two categories – trend-following signals and signals used for correction. In the case of an upward trend, it is important that the trend break below the zero level from the bottom upward occurs, and then it is possible to open a position to buy the asset. In the case of a downtrend, under these conditions, it is necessary to sell the asset. If the activity is aimed at a correction, then the index should exceed the values of +100 and -100, after which the movement will be towards the neutral area. The area between these two levels is considered neutral, in which case traders believe that the trend has used its potential and a correction has begun.
The CCI works as an independent trading system and can also be used as an additional oscillator. In this case, the trader should be guided by his preferences, strategy, and goals. When using the index, it is possible to change the settings and try different variants.
The author of the index is analyst Donald Lambert, who developed the tool in the late 1980s. Its main purpose was to make forecasts for commodity futures, but gradually the index began to be used for broader tasks. It has also proved effective for daily timeframes, but it can also be used for lower ones.
The indicator is based on the cyclic principle, and if you know how to determine these cycles correctly, you can see the end of one trend and the beginning of another. In addition, it is important to catch the signals which describe a trend and those which are used during a correction. At the same time, the trader should be able to separate false signals from true ones, for example, with the help of other analysis tools.


