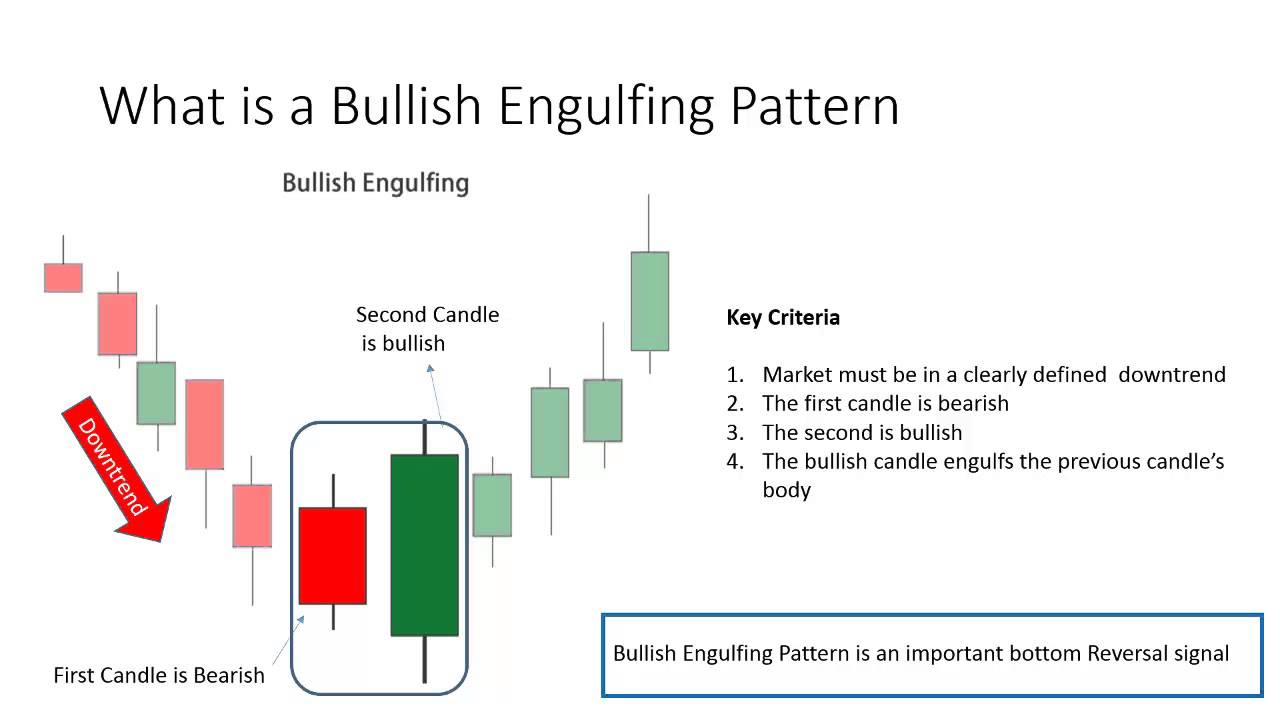
The “bullish engulfing” pattern: an overview of the characteristics
The “bullish engulfing” pattern is observed when the opening price of the second candle is lower than the same indicator of the first candle. At the same time, the closing price of the second candle is higher than the previous one. Analyzing this position of levels, the trader should understand that soon the quotes may go up and the bearish trend will end.
The structure of the pattern includes two Japanese candlesticks, one of which belongs to the absorbing candlesticks. The formation of the pattern takes place at the base, it indicates that the asset is at a strong support level, and at this point, the break begins, which is beneficial for the buyers. In most cases, the occurrence of the pattern can be seen in the Forex market, less frequently, but it is also found in the commodities and cryptocurrency markets.
There are three main features that identify a “bullish engulfing”:
1. The direction of the price. In this case, there must be a clear downtrend, and it must start at the base. A bullish pattern can be both short-term and long-term. At the same time, there are variants when the asset is consolidated for a long time, which means the accumulation of the potential for new growth.
2. The body of the second candle overlaps the body of the previous one.
3. The second candle, which is bullish, should be green or white. The first candle is red or black. It is important to consider cases where the colors of candles are the same. This happens when the body of the first candle is extremely small or it is absent, indicating that soon the price will turn to bulls, but meanwhile, there is uncertainty in the market. Support and resistance levels allow you to understand the point from which a reversal will begin. In addition, it is necessary to take into account the volume of trading operations and large market orders. For more reliable information, it is better to confirm the results of the pattern by analyzing the indicators. Thus it will be possible to develop a clearer trading strategy.
Pattern shapes can also indicate the near or distant possibility of a reversal. For example, if the first candle is small, and the second candle is the opposite, then the situation in the market may gradually change, and soon the bearish trend will weaken. In addition, in most cases, a bullish pattern is observed when there has been a downtrend in the market for a long time. Also, a sign of a pattern can be called a large volume of trading operations, which indicates a consensus for a certain price value between market participants.
The acceleration of a trend reversal is indicated if the second candle overlapped the previous one.
In order to confirm the results of the pattern analysis, the simplest technical analysis indicators are most often used.
The “bullish engulfing” is a popular pattern that does not require deep knowledge to read. However, it is still better to confirm it with additional tools.


