Patterns on the stock exchange and their types in technical analysis
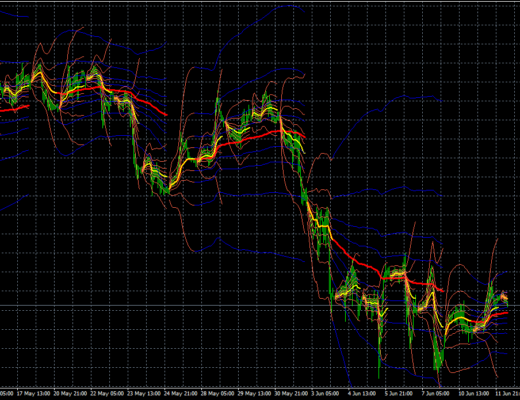
Technical analysis is a useful tool for stock market activity. It helps predict asset price movements. This method is based on the concept that the dynamics of value depend on various factors, including the mood of market participants, news, and general world trends. The key component of the analysis is considered to be the patterns on the stock exchange, which is a kind of movement pattern.
Unlike fundamental analysis, in this case we do not use financial ratios or study the news feed. Here, the pattern, which is displayed on the chart on the basis of price analysis or indicators, is formed on the basis of the cyclic principle. The appearance of the pattern in the trading terminal indicates that the price dynamics will be similar to that observed in the past, when the same pattern was displayed on the chart.
Patterns are of three types, the key factor by which the chart or pattern of analysis is classified is the direction of asset value movements. The first type is the uncertainty figures, which includes all variants that indicate the continuation or reversal of the trend. In this case, everything depends on the slope of the pattern lines from the dynamics of the existing trend. This classification includes the wedge and triangle and their modifications. ![]() The continuation patterns indicate that the price will continue its movement in the current direction. This type includes such patterns as “Box”, “Pennant” and “Flag”. “Pennant” is formed in a similar way to “Triangle”. In this case, the price range decreases with each new direction, and a narrowing corridor appears on the chart. At the same time, the upper limit of the pattern goes downward and the lower limit is directed upward.This pattern occurs most often after a sharp movement of the asset in the direction of the main trend. The optimal time to enter the trade is when the border of the “Pennant” is broken.
The continuation patterns indicate that the price will continue its movement in the current direction. This type includes such patterns as “Box”, “Pennant” and “Flag”. “Pennant” is formed in a similar way to “Triangle”. In this case, the price range decreases with each new direction, and a narrowing corridor appears on the chart. At the same time, the upper limit of the pattern goes downward and the lower limit is directed upward.This pattern occurs most often after a sharp movement of the asset in the direction of the main trend. The optimal time to enter the trade is when the border of the “Pennant” is broken.
The third type is the reversal patterns, which indicate a change of trend or correction. In most cases it occurs at record highs or at serious levels of support and resistance. The key figure of this type is the “Head and shoulders”, there are three tops, where the middle one is higher and the others are approximately at the same level. The transaction is made at the moment when there is a breakthrough at the level of the “neck” or a test after the border is passed.
For this pattern, the principle that one should not buy an asset when it is on the top is true. Selling is excluded when it is near the lower limit. The rest of the patterns in the reversal pattern are built in areas where the asset has fallen or already risen to its maximum values, and further growth or fall is impossible.