Expert Chaslau Koniukh
  • Companies
  • Global investment
  • Investors
  • Terminology
  • Economy
  • Stock Market
  • World exchanges
  • Tech and Marketing
Japanese candlesticks
Market terminology

Japanese candlesticks as a tool for a trader

27.12.2023
2 min read

How to read Japanese candlesticks correctly: an overview of the elements

Japanese candlesticks are a popular tool for Forex traders as they provide comprehensive information about price movements. This type of chart records price indicators for the opening and closing periods, reflecting the minimum and maximum prices for a given period of time. In addition, candlestick analysis allows you to get a complete picture of what is happening in the market and predict further changes in trend dynamics.

Overview of Japanese candlestick components

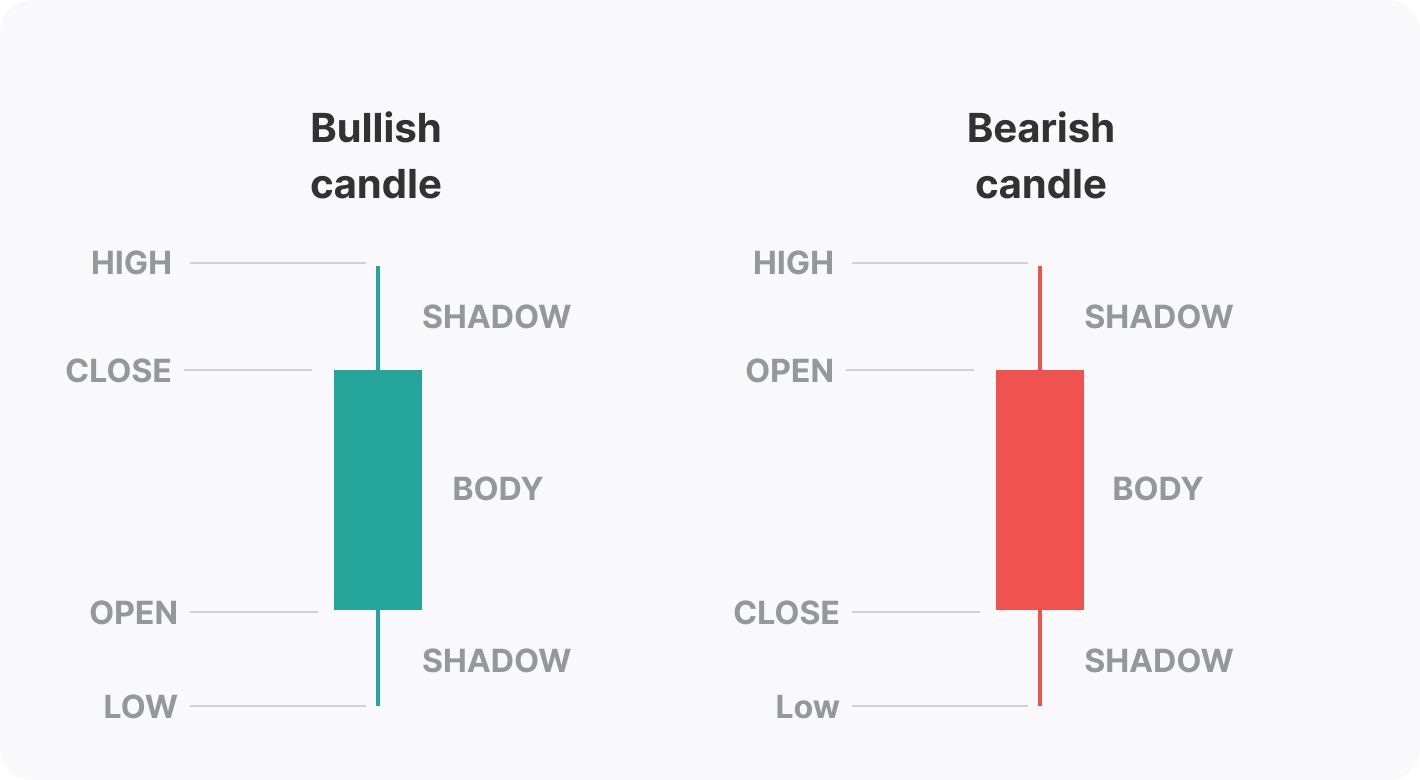
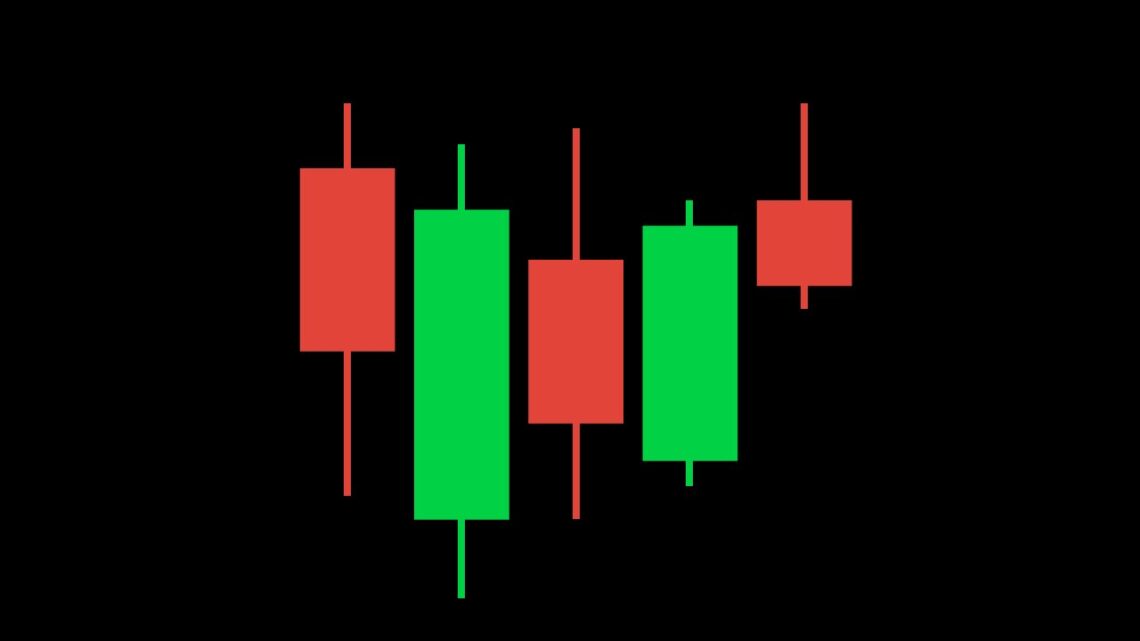
The difference between the opening and closing prices forms the body of the figure. It looks like a rectangle with lines going up and down from it. These are called the shadow or tail and wick and represent the minimum and maximum prices for a given period.
Candlesticks are red and green:
1. In the case of a red candle, the closing price is lower than the opening price. This is also known as the bearish candlestick.
2. A green (bullish) candle is when the closing price is higher than the opening price.
Sometimes the candlestick is black, and its description is similar to the red one. Green can also be white.Japanese candlesticks-2
How to read the candlesticks

The main point when working with these charts is to be able to identify the image correctly. There are three key elements in Japanese candlesticks:
– size or length;
– the relationship between the opening and closing price;
– the relationship between the body and its shadows.
A long candlestick means the price opened at a minimum and closed at a maximum. This shape is quite common and indicates that a sharp reversal is likely when a downtrend has been in place for a long time. If the candlestick has a long wick and the body is at the top of the candlestick during an uptrend, the market is most likely waiting for the trend to end.
During a strong bullish trend, traders buy the asset at the opening price. At the same time, the price continues to rise, and a green candle appears on the chart. This means that buyers are dominating the market. During the period of dominance of the bearish trend, the formation of a red candle indicates that the sellers are in control of the price movement.
The size of the wick reflects the minimum and/or maximum price value. If there is a very long lower shadow after a long downtrend, we can expect to see the end of the trend. This change can also indicate an increase in demand or a decrease in supply.
The trader realises that demand has started to fall and supply has started to rise when a long wick forms, coupled with a steady rise in prices.
It is worth noting that it is always necessary to compare the size of the shadow with the body of the candle, as their ratio can indicate the strength of the reversal.
Tags: Market terminology
0
Previous Post Argentinian software developer Globant strengthens its AI division Next Post The Lego Group: the history of the world's most famous construction toy

You Might Also Like

the price channel
Market terminology
How to build a price channel: a description of the tool
14.07.2022
Hikkake pattern
Market terminology
Hikkake pattern as a universal tool for a trader
20.04.2025
expiration of contracts
Market terminology
What is the expiration of contracts on the futures market
28.01.2022
harmonic patterns-2
Market terminology
Harmonic patterns as a tool for technical analysis in trading
18.10.2022
Negative correlation-1
Market terminology
Negative correlation as a tool for the trader
28.05.2022
venture project
Market terminology
Venture project: its features, risks and advantages
28.11.2022

Popular Posts

  • Analysts: Egypt’s economy to continue falling in 2023
  • Businessman Chuck Feeney: the man who gave the world Duty Free
  • Field of activity of the American Monsanto Company Corporation
  • Spain’s economy performs best in the EU

Editor's Picks

Chaslau Koniukh
Analytics

American bankers from JPMorgan and Goldman Sachs advise to invest in gold: review by Chaslau Koniukh.

Press Secretary
17.08.2020
Expert Chaslau Koniukh
Analytics

Chaslau Koniukh on the analysts’ opinion on the key stake size change soon

Press Secretary
18.06.2020
expert Chaslau Koniukh
Analytics

Chaslau Koniukh: Internet trade market in Russia may reach 2.78 trillion rubles.

Press Secretary
30.05.2020
Will the U.S. oil shale industry be able to quickly recover from the crisis: A Review by Chaslau Koniukh
Analytics

Will the U.S. oil shale industry be able to quickly recover from the crisis: A Review by Chaslau Koniukh

Press Secretary
16.05.2020

Popular Posts

  • Analysts: Egypt’s economy to continue falling in 2023
  • Businessman Chuck Feeney: the man who gave the world Duty Free
  • Field of activity of the American Monsanto Company Corporation
  • Spain’s economy performs best in the EU
  • Li Ka Shing: How can success be achieved without money and education?
Expert Chaslau Koniukh
  • Facebook
  • Twitter
  • Instagram

© 2024 CHASLAU KONIUKH. ALL RIGHTS RESERVED. Expert in marketing and project management, international investments, financial analyst.

Menu

  • Biography
  • Companies and corporations
  • Global investment
  • Investors and Entrepreneurs
  • Economy
  • Market terminology
  • Stock Market
  • World exchanges
  • Tech and Marketing
  • Analytics