Gartley Butterfly pattern: features of the harmonious trading model
The Gartley Butterfly pattern refers to the concept of harmonic trading, which is considered to be more accurate compared to graphical patterns. This pattern is basic and shows the recovery of the price movement. Thanks to the Butterfly, it is possible to suggest how a trend reversal will be carried out when a new phase arrives. In addition, when combined with Fibonacci ratios, the pattern makes it possible to identify anticipated reversal zones.
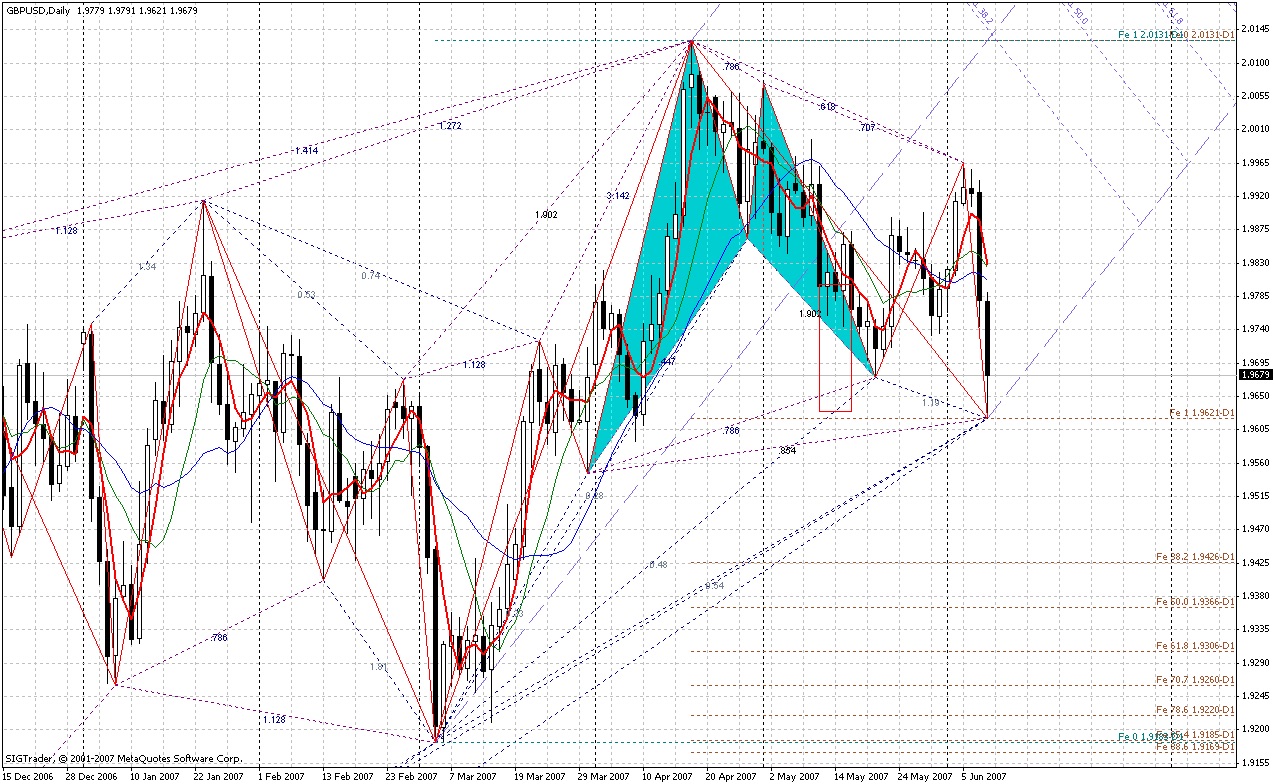
One of the main differences between the Butterfly and other patterns is that it uses explicit Fibonacci ratios to build it. The figure is composed of 4 movements that are visually similar to Elliott waves. The turning points are denoted by letters, the first of which is X, and the extremum is A. Then different segments are formed from them, for example, AB and CD, which are sequentially placed on the wave of volatility.
At first glance, this pattern appears to be a reversal trading pattern. As soon as it ends, the price makes a sharp reversal – and thus an impulse occurs. However, the Butterfly can also be viewed in more depth. For example, it often warns of the start of a new trend that is larger than the previous one.
Trading on the harmonic principles began in 1935, while the pattern of the Butterfly appeared later. It is named after Harold Gartley, who created the price movement patterns. Over time, it became known about the different types of Butterflies, for example, the pattern, which has an ideal ratio of Fibonacci proportions, was named Butterfly Pesavento. Now technical indicators on various special platforms are used to identify patterns.
All 4 waves included in the pattern are united by common construction rules. If the pattern follows these rules in the analysis, then each of them deserves one point. If the pattern receives 5 points in the process, then it is the Butterfly itself, which means you can read the signals and open orders based on them. X leg indicates that there is price activity and any. The movement should be directional. The XA wave, which goes up, indicates a bullish trend, while the downward movement indicates a bearish trend.
The opposite of XA is wave AB. The length of the latter should be about 78.6% of leg X. In the opposite direction moves BA.
The main advantage of the Butterfly is its accuracy. In addition, the trader can chart even before the occurrence of a certain movement in the market. He marks the potential points that will talk about the reversal and will be able to designate the zone for entering the market in advance. However, it should be understood that no tool can be 100% accurate. Therefore, it is important to consider the possible risk.


