The Doji candlestick as a stock trading tool
A Doji candlestick is a concept in trading, which is one of the modifications of models for analyzing the situation in the market. Externally, it resembles a bar chart, and its appearance indicates a normal state of affairs in the market.
The peculiarity of the candlestick is the absence of the body. This is due to the fact that the opening price at the beginning of the segment closes at the same mark. There is also a variant when the body is present, but it is very small, and the shadows on the contrary – are long both above and below. The Doji candlestick indicates that the price movement has stopped, which increases the probability of reversal, both in the case of ascending and descending trends.
It is important for the trader to follow the appearance of the figure. Particular attention should be paid to the position of the candlestick – on the top line or at the beginning of the timeframe when analyzing the asset during the day. Such a position indicates that quite soon it is possible to observe a reversal in the bearish direction or to expect a correction.
In the classic version of the candlestick opening and closing prices are similar, but allowed to differ by a few points. Using this model in trading, it is necessary to obtain confirmation of the data using other tools, such as indicators of technical analysis.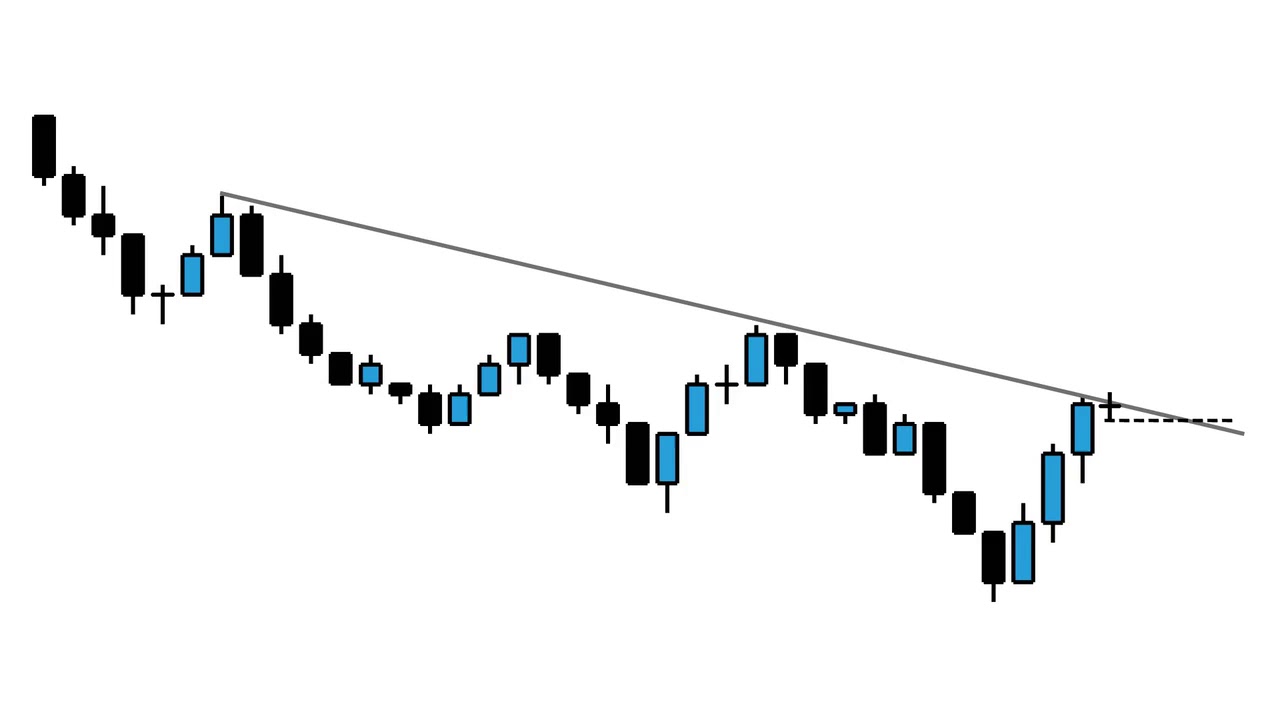 The candlestick may indicate a drop in demand, for example, when there is a prolonged rally in the bull market or the asset is overbought. The Doji pattern is less strong during a downtrend because then the chances of price decrease as well as growth are equal.
The Doji candlestick is considered to be a strong enough pattern, but some of its types can be more or less significant.
The long-leg “Doji” is characterized by the presence of elongated shadows both at the bottom and at the top of the chart. In this case, traders pay attention to the value at the top as an indicator of an uncertain market position.
“Dragonfly” is built in the form of the letter “T”. Most often this variant is present during a downtrend, but it can also be present during a rising trend. In this case, the candlestick has a long shadow at the bottom, in contrast to the upper one, which may not be present at all. This indicates that the pattern is bullish.
“Tombstone” – This candlestick is formed due to the fact that the opening price is initially minimal, and then goes sharply upwards. By the time it closes, the price rolls back again. This kind of pattern alerts us to bearish activity: the more pronounced the shadow in a downward candlestick, the higher the probability of reversal.
When using a Doji candlestick in trading, it is important to set a specific time period and levels. In addition, it will be useful to confirm the data of this model with indicators of other types of analysis.