Expert Chaslau Koniukh
  • Companies
  • Global investment
  • Investors
  • Terminology
  • Economy
  • Stock Market
  • World exchanges
  • Tech and Marketing
Directional Movement Index
Market terminology

Directional Movement Index as an additional trading tool

14.01.2025
2 min read

What is the Directional Movement Index and how to use it?

The Directional Movement Index confirms signals from other instruments. It can track the starting point and direction of a trend and help identify reversal points.
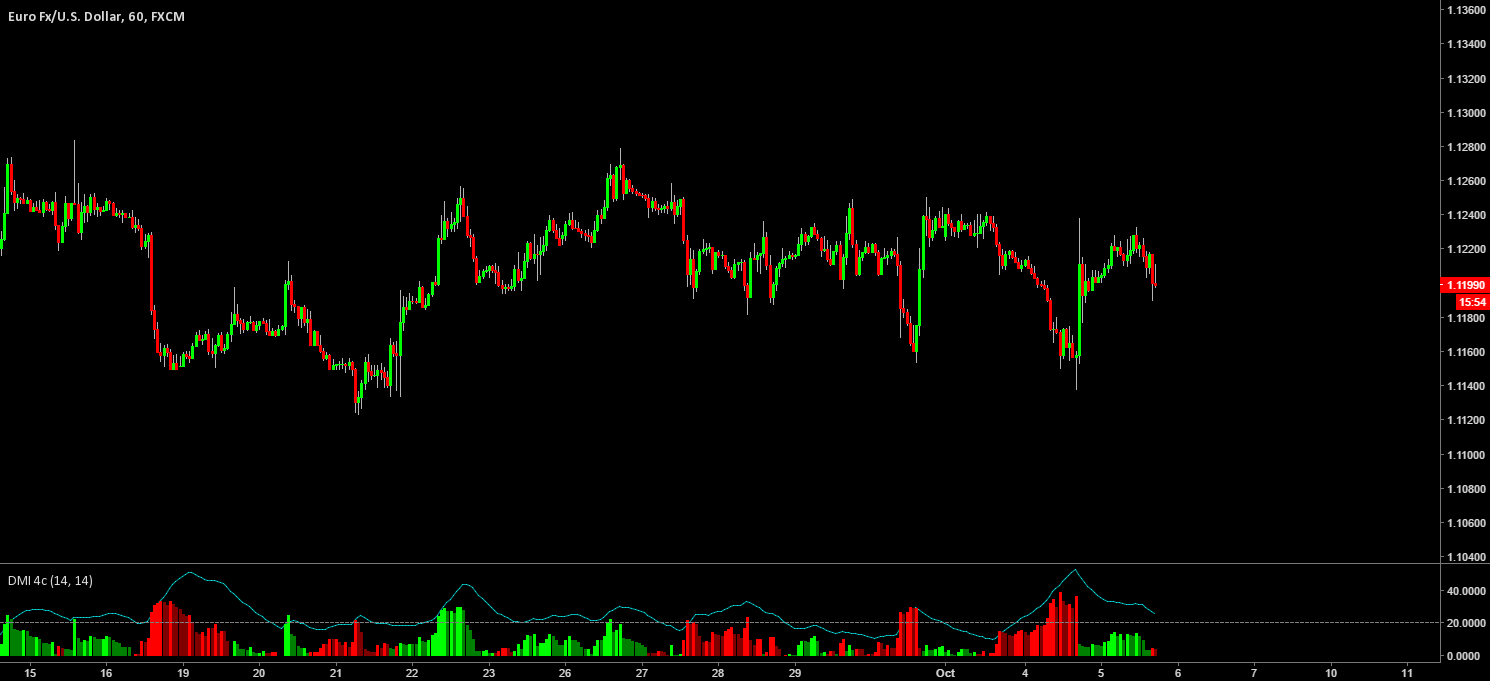
The DMI is an oscillator based on two curves. The indicator can be found below the price chart.
The index contains the following elements:
1. +DI (Positive Directional Indicator). It indicates an upward trend and reflects its strength.
2. -DI (Negative Directional Indicator). Reflects a downward trend.
The DMI is the base for calculating the ADX – Average Directional Index. In some sources, DMI and ADX are combined into one indicator of trend strength. The main difference is that the ADX has an additional average index line, which strengthens the evaluation of the trend.

How to use the tool

One of the advantages of the index is its interpretation. The starting point is the crossing of the lines. Whichever line is rising indicates where the market is heading:
– if the +DI rises, an upward trend is probable;
– if the -DI is rising, a downward trend is likely.
It is also necessary to look at the height of the lines compared to previous levels. If it rises much higher than previous peaks, then the end of the trend should be expected.Directional Movement Index (DMI)
Advantages and disadvantages

Like any other tool, the DMI has advantages and disadvantages. An optimal trading system can compensate for some of the disadvantages.
Index’s pros:
– simple interpretation of signals, such as the position of lines, direction or distance between them;
– screening out false signals, which is particularly important in flat weather;
– flexibility in using other indicators to complement it;
– versatility of use for different installations.
Despite the pros, DMI has some cons, among which are:
– it is not compatible with short-term timeframes as it gives false signals;
– signals can be delayed, which affects the efficiency of the activity;
– is only suitable for use in trending markets;
– serves only as an additional tool to reinforce the signals of other indicators.
The tool is compatible with standard trend indicators. These are mainly moving averages and alligators. With the help of the DMI, you can confirm this or the result of other indices.
Traders also use indicator in conjunction with reversal patterns to indicate a change in trend. DMI confirm signals from resistance levels and trend lines.
Aroon indicator is suitable for similar applications. It differs from the DMI in how it operates. In addition, the DMI has smoother lines, which may be preferable in certain conditions.


Tags: Market terminology
0
Previous Post European Bank for Reconstruction and Development increases investments in RES Next Post Japanese brand Shiseido: synonymous with elegance and luxury

You Might Also Like

Robert Prechter's theory
Market terminology
Robert Prechter’s theory as a tool for analysing market sentiment
11.12.2023
What is a bill of exchange
Market terminology
Bill of exchange: how to correctly draw up a document
17.06.2022
equity
Market terminology
Equity and its importance for a trader
20.06.2024
fractal
Market terminology
Fractal pattern and its peculiarities for trading
16.03.2024
junk bonds
Market terminology
Junk bonds: characteristics of securities with low credit ratings
02.02.2021
the Spinning top candlestick pattern-2
Market terminology
How to use the Spinning top candlestick pattern to study market trends
23.06.2025

Popular Posts

  • Li Ka Shing: How can success be achieved without money and education?
  • Skolkovo analysts: the Russian energy market is suffering losses
  • Ingeborg Mootz: a woman who became a stock player at the age of 75
  • Analysts: Egypt’s economy to continue falling in 2023

Editor's Picks

Chaslau Koniukh
Analytics

American bankers from JPMorgan and Goldman Sachs advise to invest in gold: review by Chaslau Koniukh.

Press Secretary
17.08.2020
Expert Chaslau Koniukh
Analytics

Chaslau Koniukh on the analysts’ opinion on the key stake size change soon

Press Secretary
18.06.2020
expert Chaslau Koniukh
Analytics

Chaslau Koniukh: Internet trade market in Russia may reach 2.78 trillion rubles.

Press Secretary
30.05.2020
Will the U.S. oil shale industry be able to quickly recover from the crisis: A Review by Chaslau Koniukh
Analytics

Will the U.S. oil shale industry be able to quickly recover from the crisis: A Review by Chaslau Koniukh

Press Secretary
16.05.2020

Popular Posts

  • Li Ka Shing: How can success be achieved without money and education?
  • Skolkovo analysts: the Russian energy market is suffering losses
  • Ingeborg Mootz: a woman who became a stock player at the age of 75
  • Analysts: Egypt’s economy to continue falling in 2023
  • Businessman Chuck Feeney: the man who gave the world Duty Free
Expert Chaslau Koniukh
  • Facebook
  • Twitter
  • Instagram

© 2024 CHASLAU KONIUKH. ALL RIGHTS RESERVED. Expert in marketing and project management, international investments, financial analyst.

Menu

  • Biography
  • Companies and corporations
  • Global investment
  • Investors and Entrepreneurs
  • Economy
  • Market terminology
  • Stock Market
  • World exchanges
  • Tech and Marketing
  • Analytics