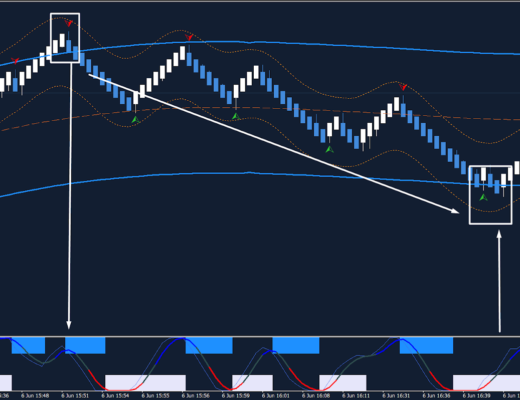
Support and resistance lines as an important tool for the trader
One of the key principles for technical analysis in trader’s activity is the support and resistance line. Other indicators, such as averages and series, emerged on the basis of this tool. Lines are important for market analysis, and they are widely used by investors from different spheres.
This tool is an indicator of when market players who focus on different trends will be able to face. Traders who drive prices up or bulls and bears who drive prices down are at some point at a point where each group has the same effect on the situation. The resistance line is the limit above which the bears keep prices from rising. As soon as the price tries to overcome this barrier, traders begin to get rid of assets, including the use of leverage. In this case, the bulls try to lower the resistance, and if they fail, the price goes down. The support line, in its turn, is the lower limit of price held by the bulls.
However, it should be noted that when this line is broken, there is no guarantee that the price will continue to rise. Such cases often take place in the stock exchanges, so it is necessary to take this probability into account and revise your strategy.

In simple terms, the support and resistance lines define the levels where the probability of a price correction increases.
This tool is used to identify the strength of a trend. A trend represents the dynamics of the price, up or down, for a long period of time. The value of the asset in this case can fluctuate, but if its minimum values regularly go up, then the trend is upward. If the maximums are decreasing, then the trend is considered to be a downtrend.
For the stock market, calculating the trend allows you to assess long-term investments, as well as to analyze how successful short-term speculation will be. Determining the trend is based on the price of the asset.
To apply the tools to market activity, first of all analyze the behavior of the trend when it reaches resistance and support lines. If the resistance level is broken through, then it is possible to talk about a probable rise in price. If the support level is broken through, then the price will go down. The trend reversal can be accompanied by a decrease in trading volumes. This suggests that market participants are not as interested in the asset as before.
When using the support and resistance lines, it is necessary to consider the general factors that affect the exchange processes. The price cannot rise or fall all the time, at some point the market trends will change and a quick decision will have to be made.


