Renko charts: advantages and disadvantages of the indicator
Renko charts are one of the financial market indicators invented in Japan. The word Rengo translates as “brick,” and the image itself is of equal-sized bricks that overlap each other at a 45-degree angle. When the chart reaches a certain threshold, the next element appears. A white bull bar appears if the asset price rises above the specified limit. This “brick” is placed near the previous one, shifting slightly in width. As a result, the minimum level of the new element is on the same line as the maximum value of the previous one.
A bearish black bar appears when the asset’s price decreases by the number of points equal to the minimum value of the previous bar. In this case, the minimum values of the last item and the maximum values of the new one will be the same. There is no time dependence in this chart. The formation of the next element can take seconds or days. The advantage of Renko’s approach is considered the low influence of noise, as in this case, the primary attention is paid to the price dynamics, which can rise or fall within the specified range.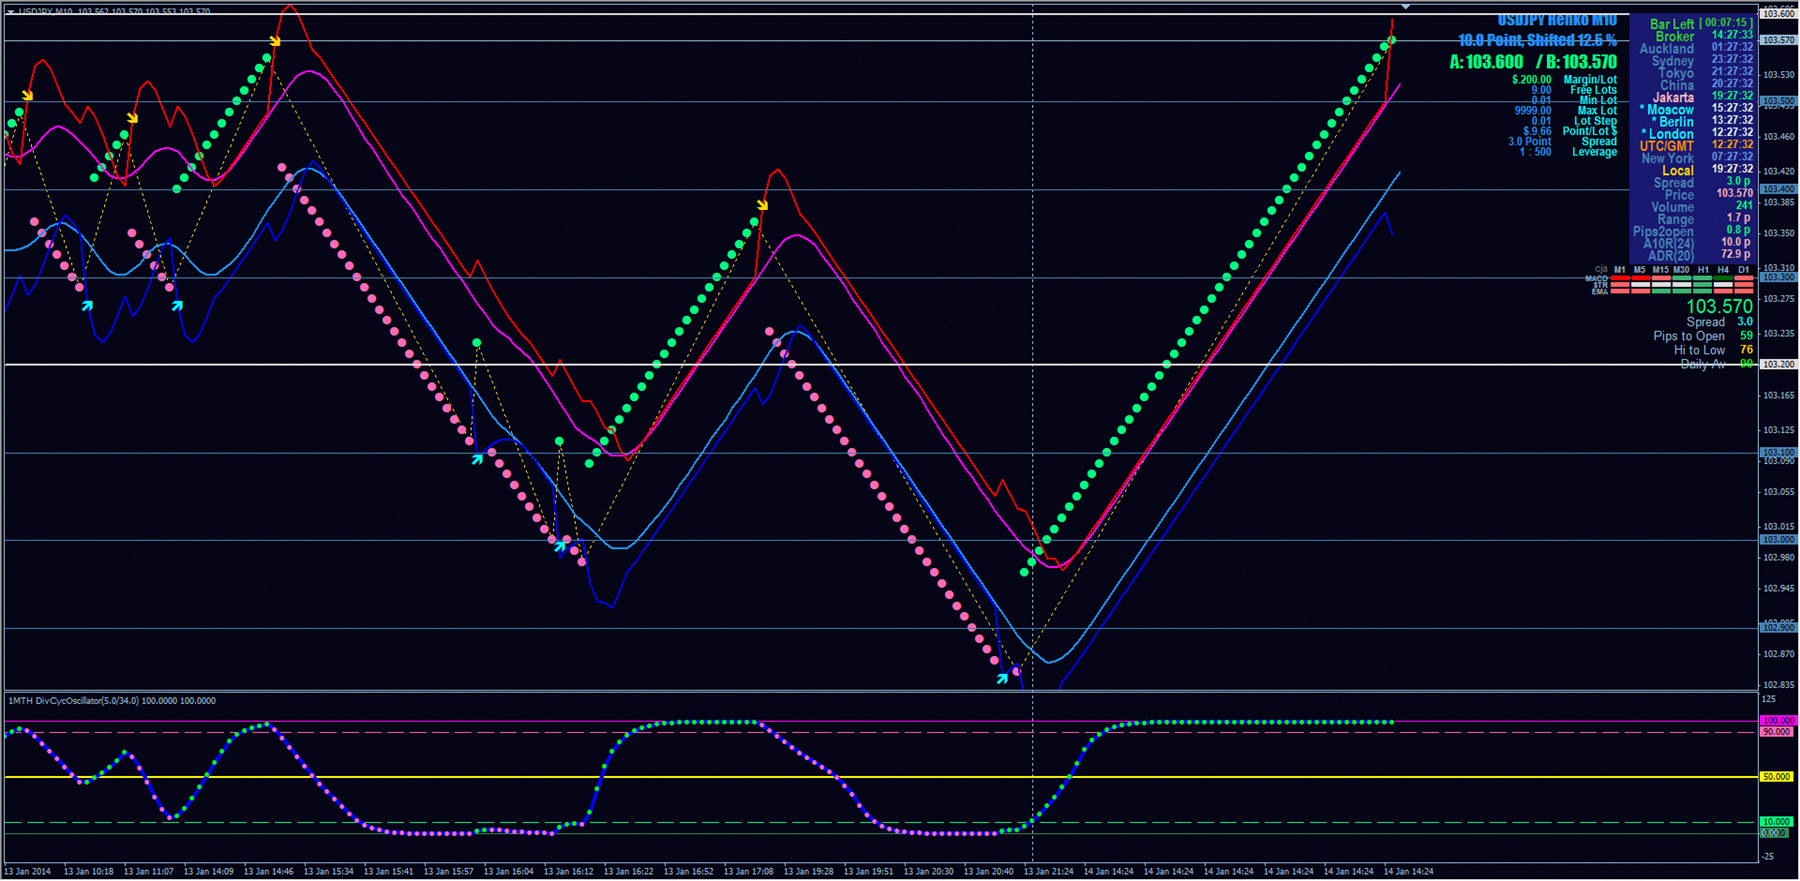 The main parameter on the chart is considered to be the threshold. The larger it is, the fewer bars will be formed, which minimizes market noise. However, it should be borne in mind that a high threshold overrides price movements, especially for smaller values. This increases the risk of not noticing important points on the chart and missing out on good options to enter a trade or the opportunity to buy an asset once the correction is over.
The height of the ‘brick’ is determined based on the volatility of the asset and a certain period, e.g., within a week. In general, Renko is similar to a candlestick chart, but visually it is more evident. In this case, the chart does not show useless price movements that only overload the picture. That is why many traders choose Renko as their trend identifier. A sequence of elements of one color indicates an uptrend. At the same time, including a bar of a different shade is a precursor of a corrective movement in the market or a reversal.
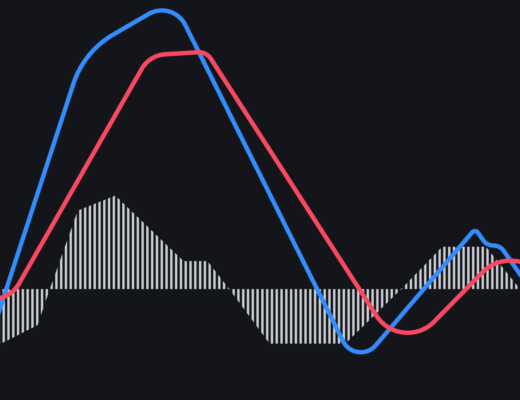
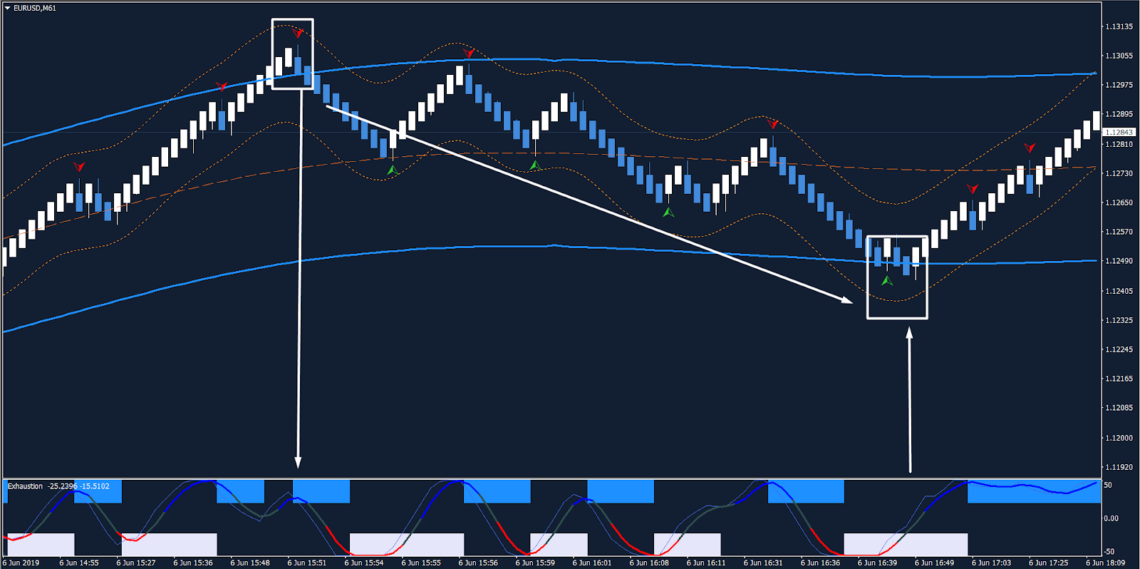
Renko allows you to determine the direction of trends and indicates support and resistance points. Some technical analysis indicators can be used based on a chart. However, it is crucial to understand that their appearance will be different from traditional ones since there is no time reference in Renko. At the same time, the value of oscillators will be more understandable for analysis, as well as the overbought and oversold zones.
It should be noted that this chart does not consider volatility, which makes it useless for strategies based on this indicator.