Types of moving averages: use of indicators
Technical analysis contains a huge number of tools that help in the work of the broker. Moving averages are considered to be one of the most demanded and reliable. Many traders use them in order to follow the movements on the market and analyze the probable changes. There are different kinds of moving averages, the main of which are simple – SMA, and exponential – EMA.
Moving averages belong to the category of lagging tools, their function is to determine the existing trend through reducing the influence of fluctuations and noise. By analyzing trends, traders take steps to increase profits.
A moving average is obtained by finding the average price of a stock over a certain period of time. To calculate the SMA indicator type, it is necessary to take the arithmetic average of one or another set of values. For example, for a simple 10-day moving average, you must take the sum of the closing prices of those days and divide the figure by 10. Despite the popularity of the SMA among market participants, it has a number of drawbacks. There is a risk here that each point in the data set may have an identical weight regardless of the sequence. In addition, recent data may be more important to the valuation than previous indicators. To increase the role of new data, the EMA or exponential moving average was introduced. In this case the indicator reacts faster to price movements, it is more sensitive to changes than SMA. That is why traders more often prefer to work with EMA.
When setting up moving averages, you should consider the fact that the sensitivity of the indicator is higher on a small time interval. However, there is no optimal variant of the interval – it is all selected individually.
With the help of moving averages you can determine the trend direction, identify areas where the asset will meet support or resistance. In addition, using the moving averages, you can set stop-loss orders.
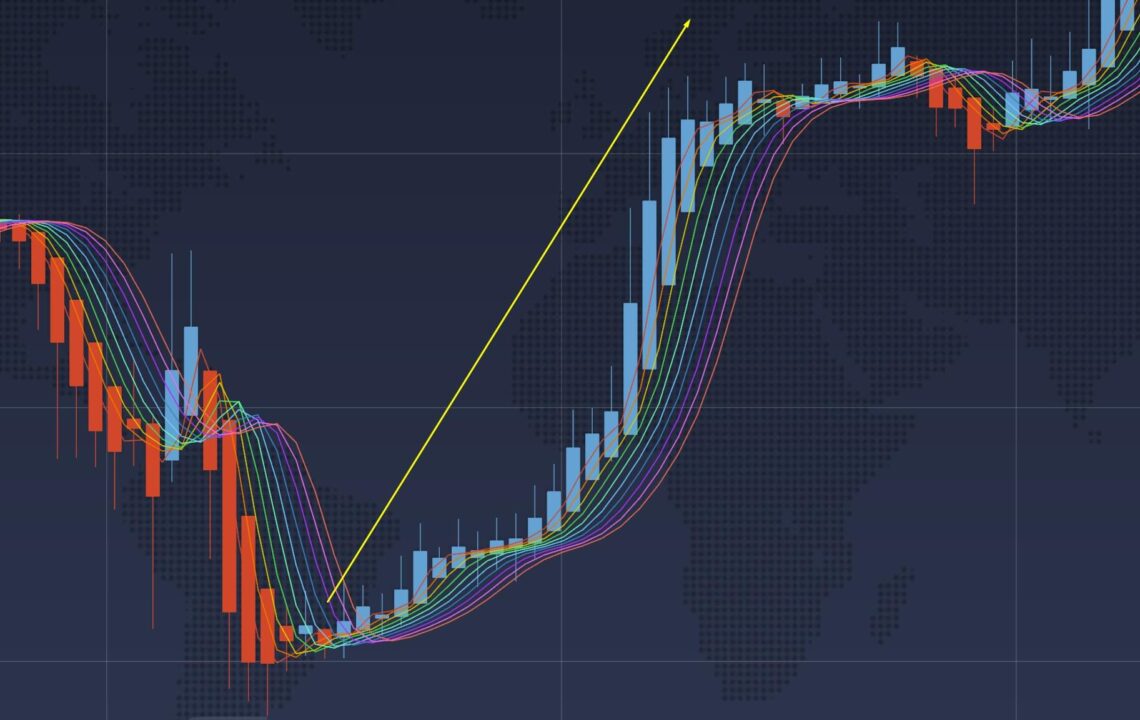
It should be understood that this indicator is a lagging indicator, so it does not show changes in the trend, and analyzes the current situation on the market. The upward trend is indicated by the price location above the level of the moving average, and in case of a downward trend its position will be below the line of the indicator.
Another way to use the indicator is to identify potential price supports. Decrease in price in most cases slows down near the moving line. Also, when analyzing the time intervals of 50 or 200 days there is a rebound, but in this case you need to collect data from other indicators.
The SMA and EMA serve as useful tools for analyzing a stop loss. By identifying these areas, the trader can close positions in time, where there is a risk of loss.


