Spinning top candlestick pattern: pros and cons
The Spinning top candlestick pattern is a neutral technical analysis pattern. It indicates uncertainty in the market. Its appearance on the chart suggests potential changes. This indicator should be used alongside other tools to confirm the trend.
The pattern consists of a small body and long upper and lower shadows. The optimal ratio between the body of the candle and its total length ought to be minimal. This indicates a balance between market participants.
Distinctive signs of the pattern include:
1. The small body indicates a real price change.
2. The long shadows indicate high volatility and price fluctuations during the trading session.
This candlestick pattern demonstrates that neither the bulls nor the bears have a clear advantage. At this stage, it is impossible to determine which side will eventually prevail.
Long shadows are a sign of high activity during the trading process. At the same time, the absence of dominance by either party emphasises balance in the market.
This pattern most often appears at the end of a trend. After an upward trend, the wick indicates weakening buyer pressure. Its appearance after a downtrend suggests a loss of strength on the part of the sellers.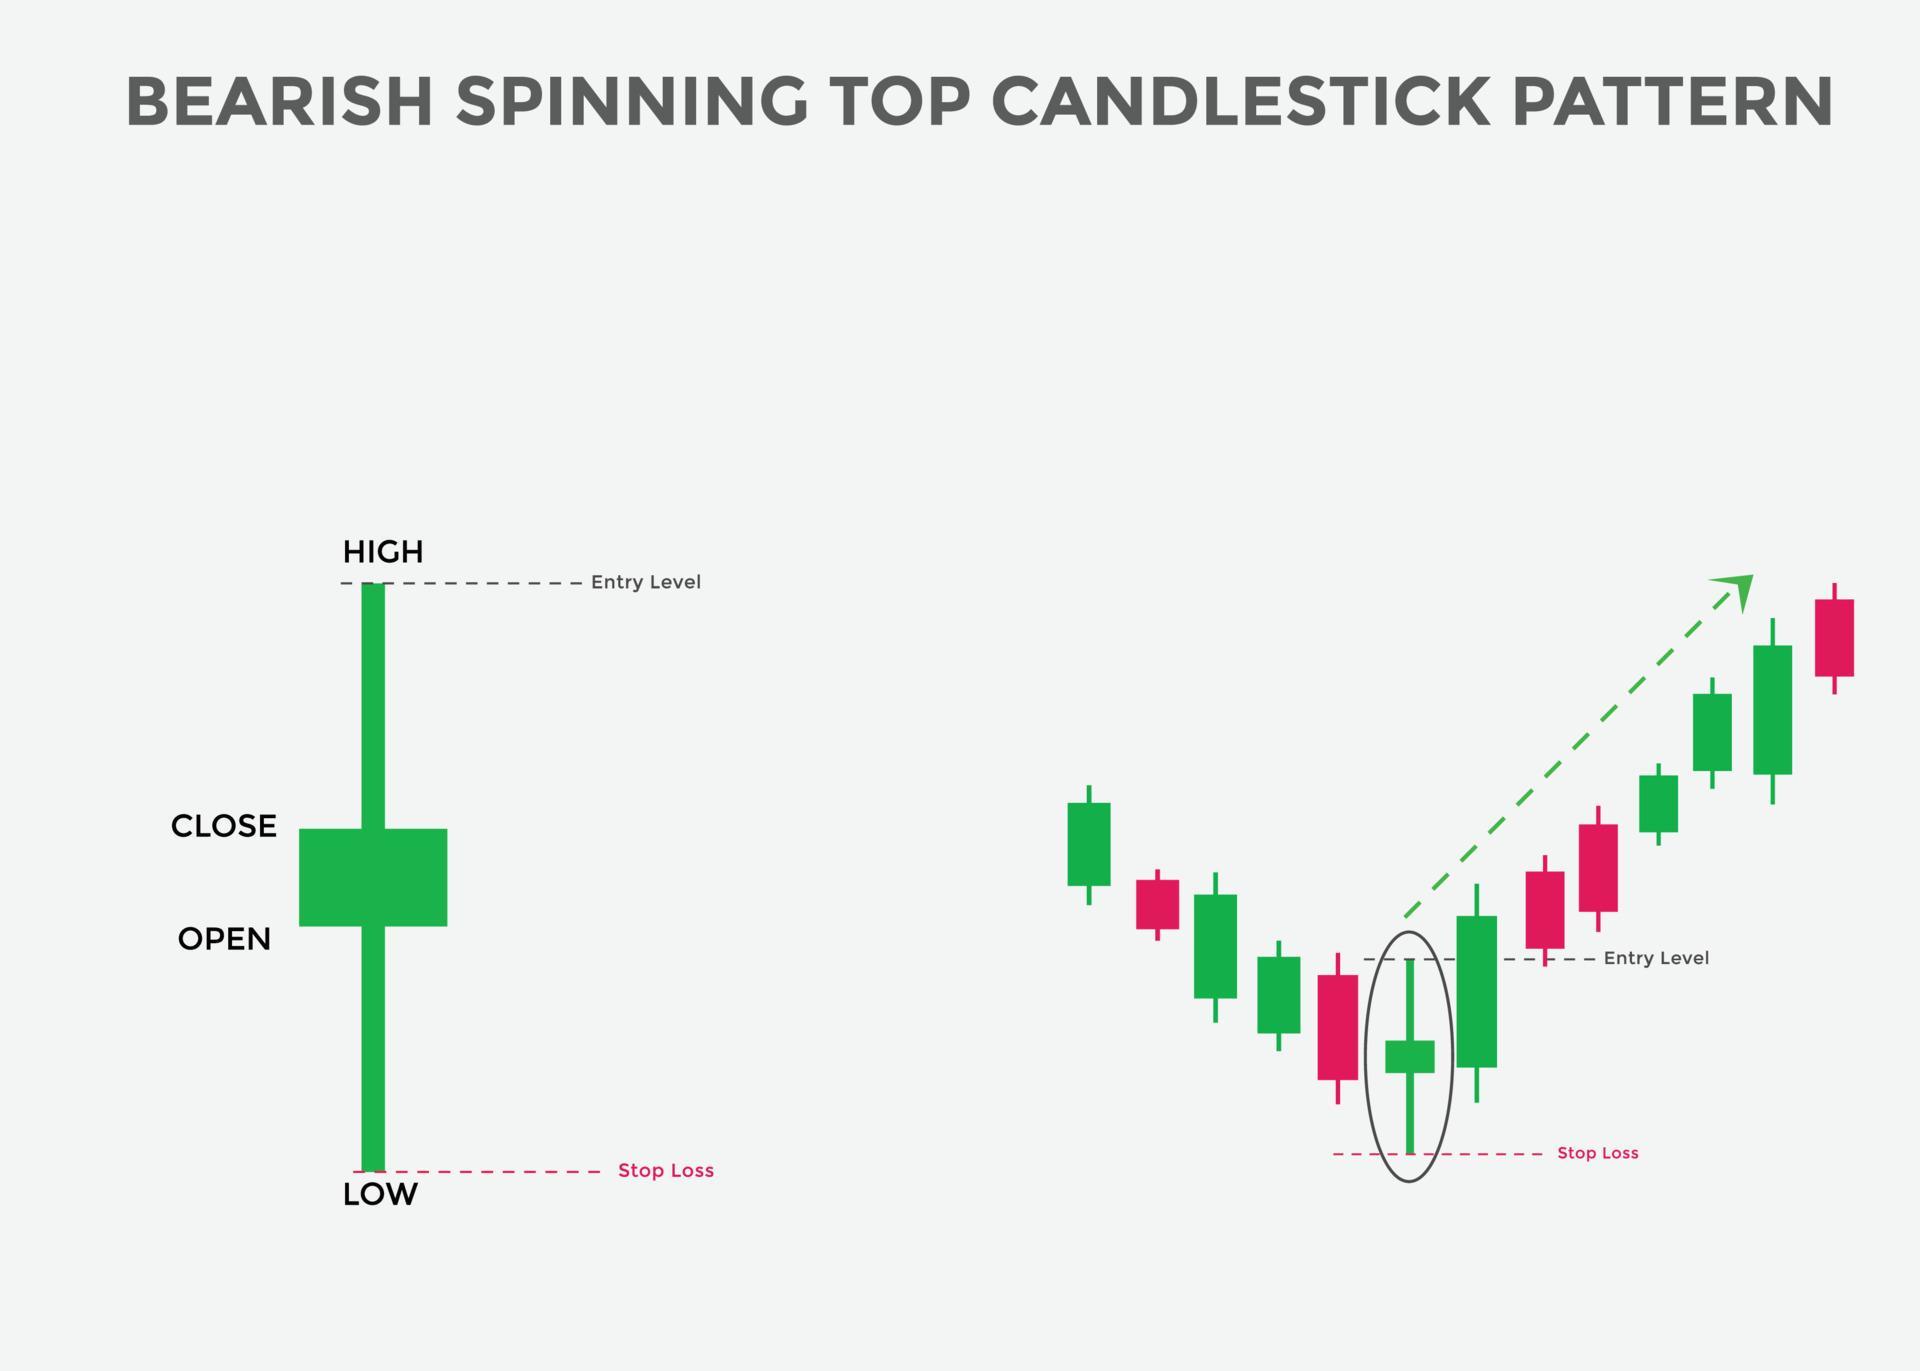
Variants of using the pattern
The candlestick can become a useful tool in combination with other indicators. With its help, you can get the following information:
1. Confirm the signal. In this case, it is better to open a position after checking other technical indicators.
2. Determine the entry and stop-loss points. For longs, the optimal place to set the latter is the area above the maximum. For short positions, the stop loss will be below the minimum.
3. Set the take profit level. In this case, the risk-to-profit ratio should be no less than 1:2. The ideal ratio is 1:3.
4. Manage risks. For one transaction, the rate should be no more than 1–2% of the deposit size.
Conditions of application
For the Spinning top candlestick pattern to be effective, it must be part of a combination of technical analysis tools. Despite this pattern’s convenience and informative nature, caution is necessary when interpreting it. This is due to a number of disadvantages inherent in candlesticks. It only indicates market fluctuations. The pattern does not indicate whether bulls or bears will gain the upper hand. Additionally, the Spinning top pattern often demonstrates false breakdowns and reversals due to low volatility and sharp price fluctuations. When analysing using this pattern, you should consider the general situation in the market.
Using a pattern as an independent analysis tool carries a high level of risk, particularly for novice traders. Due to its limited informativeness, the pattern can provide a distorted view of the current market situation. This can be misleading when making trading decisions. Therefore, it is advisable to consider the Volchok exclusively as an additional analytical tool.