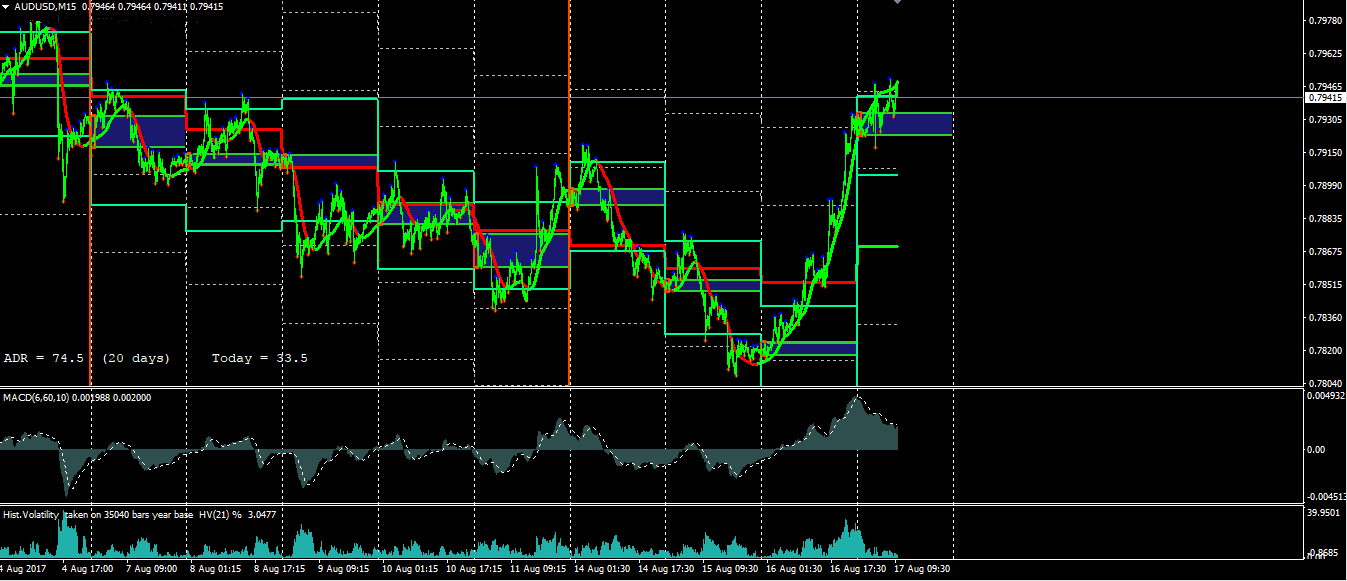
What information is available from the Average Daily Range
The Average Daily Range indicator is based on a search for statistical patterns. On the basis of these patterns, it advises the trader when to take profits and when to open new positions. The indicator provides information about the daily movement of an asset. ADR belongs to the category of technical indicators that use a formula to average a specific value.
Understanding the daily range of a particular asset allows you to think about further action – buying or selling. This information is especially useful for day traders who calculate how many pips an asset has to move before they can open a position. The ADR indicator takes care of all the calculations and provides data on the remaining distance, expressed as a chart or table. The indicator applies to a wide range of financial instruments.
Application of the indicator
The indicator is excellent for assessing the current market situation. It allows you to understand whether it is advisable to open a trade when an asset has already exceeded a certain number of points. Around 80% of trades are almost at the limit of the daily movement of the instrument. In the remaining 20%, the asset is outside the ADR. Based on this, the optimal solution for a trader would be to set the profit targets for the day within the daily movement. This approach increases the chances of closing the trade at take profit. Players often set targets near the ADR level and stop trading when the price exceeds the indicator.
The indicator analyses past data to understand how many pips an asset can move. This is usually 20 days. ADR allows you to:
– carry out an automatic calculation of the limits for the current trading day;
– determine potential levels at which supply or demand will rise or fall;
– identify price highs and lows;
– create additional support and resistance levels on higher timeframes;
– find points to take profits.
The indicator performs all calculations automatically and provides the trader with data in an easy-to-understand format. In some versions of the ADR, it is possible to analyse the daily movement as well as the weekly or monthly movement. The advantage of the indicator is its ease of use. Its settings are understandable even for novice traders. It is also possible to develop an effective trading strategy by combining ADR with several other indicators. However, the indicator has some drawbacks. For example, some versions do not allow displaying levels from their maximum to minimum values. In this case, they are constructed from the opening price. It should be understood that ADR is not an independent trading system. The indicator only analyses statistical data.


