The Tweezers candlestick pattern: how to work with the tool
Of all the technical analysis indicators, the Tweezers candlestick pattern ranks among the most accurate. Its main advantage is its clarity of interpretation. The pattern is based on two candlesticks with identical maximum and minimum levels. In rare cases, there may be three consecutive candlesticks with these characteristics.
The Tweezers pattern indicates a probable trend reversal. This occurs when the candlesticks have identical highs or lows. This combination shows that the market has attempted twice to break through a specific level. However, it has not succeeded. When these trends occur, experts consider a reversal highly probable. The key factor here is the weakening of the trend.
According to expert Steve Nison, Tweezers demonstrates maximum accuracy when placed at key support and resistance levels. The pattern has two combinations:
1. Bullish. The candles are located at the same height — Tweezers Top. This is a good time to open a short position. In this case, the stop loss should be set above the maximum value.
2. Bearish: It is distinguished by similar lows and is called the Tweezer Bottom. When opening a long position, you need to act oppositely.
At the same time, the ratio of bodies and other shadows may vary. These variations may indicate the formation of other patterns. For instance, when a bearish candle passes through a bullish one, an Engulfing combination occurs.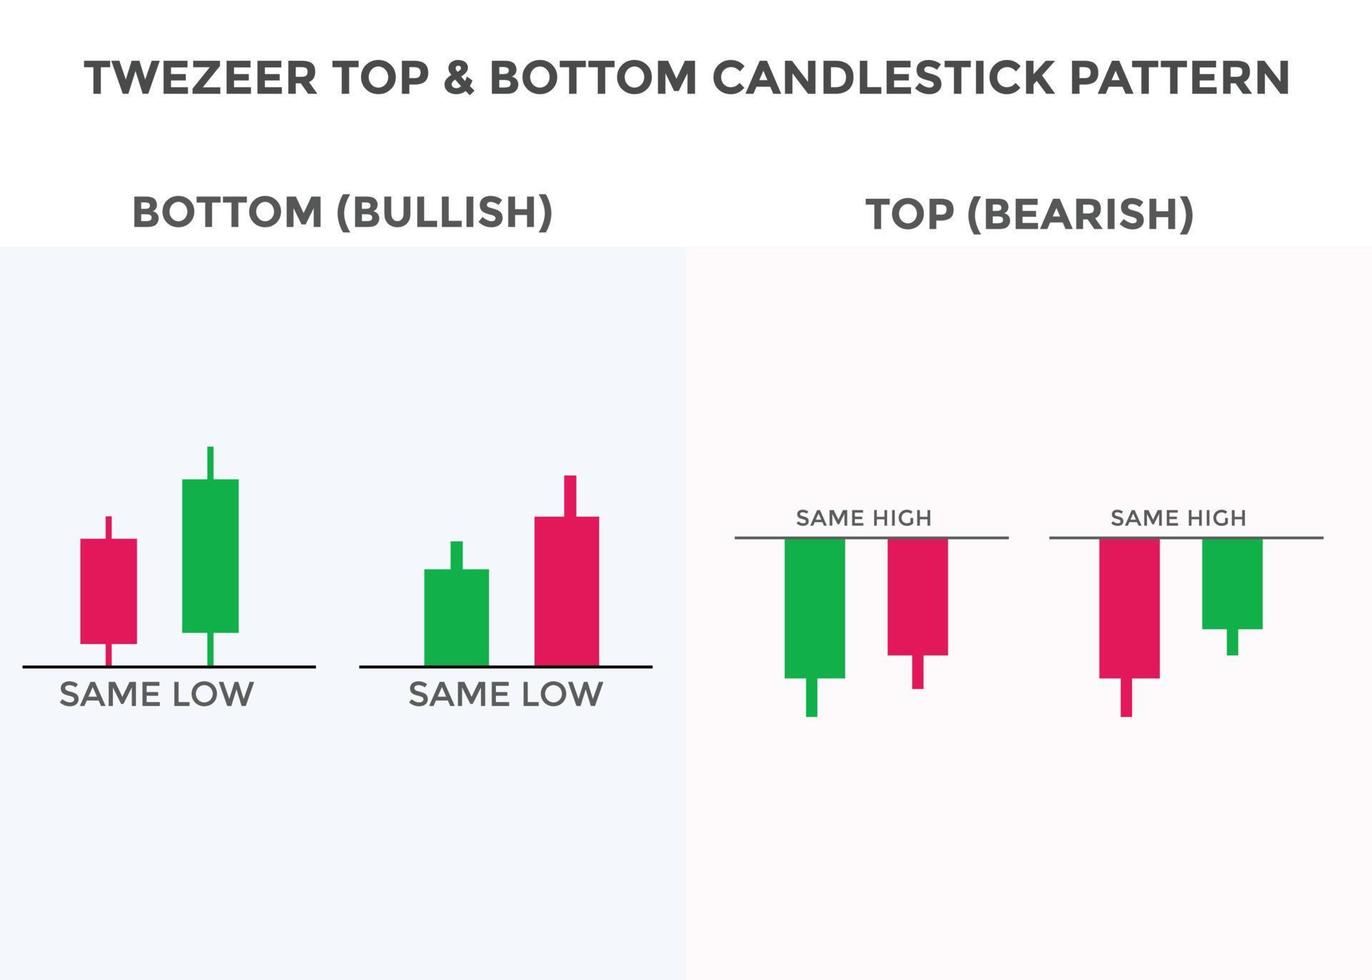
How to work with the pattern
The pattern indicates a minor reversal if other indicators do not confirm the result. Conversely, the accuracy of the Tweezers pattern increases when it appears on a weekly or monthly timeframe.
Traders who use Tweezers in their strategy should be extremely cautious. When a Top appears, close any long positions. However, it is not worth it to actively open short positions. The same is true for the Bottom. You should close shorts and wait for new trades.
It is important to consider Tweezers as a tool for strengthening reversal patterns. The indicator transforms minor patterns into significant ones. This gives traders a signal to start trading. At the same time, traders should pay attention to elements that appear in a sideways trend. These signals reduce the likelihood of significant reversals. A stable level of support or resistance may also form here. In some cases, a flat pattern can indicate unstable market sentiment, such as before the release of important news.
The combination of two candles into one can also indicate something else. Increasing the scale by about two times can turn the pattern into another figure, such as a spinning top. This suggests a slowdown in the market.