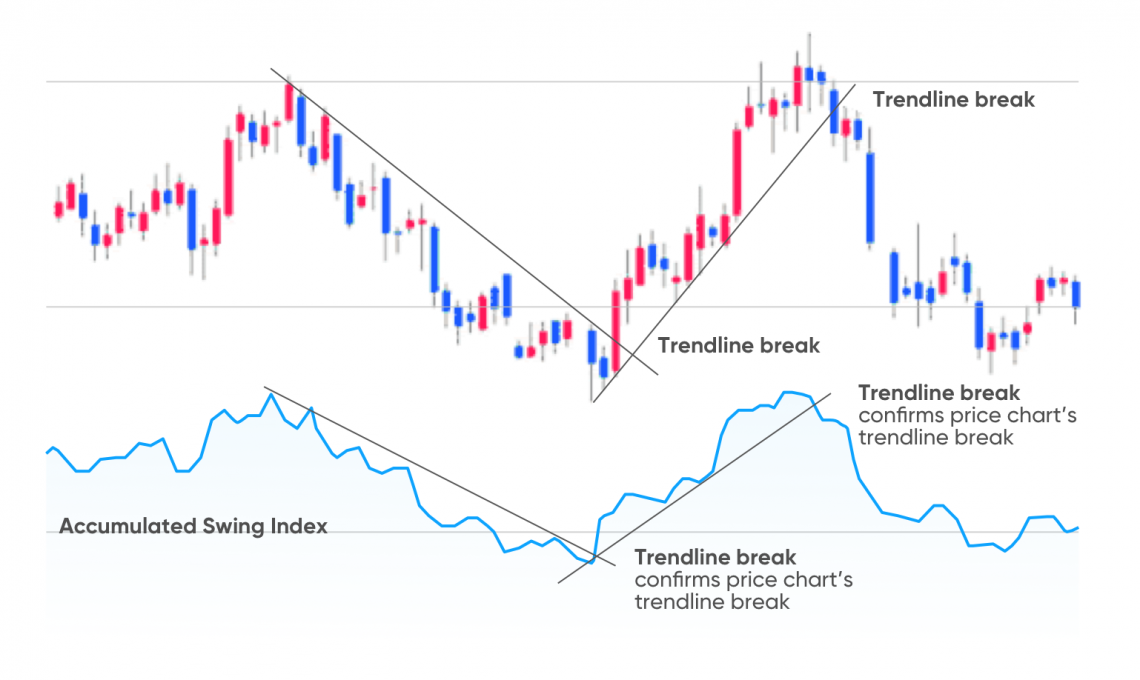
What is the Accumulative Swing Index?
The Accumulative Swing Index (ASI) provides traders with a general assessment of price fluctuations. It is a technical analysis tool that offers a picture of an asset’s movement. The index is effective for both short-term and long-term trading strategies.
Wells Wilder, who developed it on the basis of the Swing Index, is the author of the ASI. This tool aims to solve several tasks:
– tracking price dynamics in the market;
– fixing breakdowns at resistance and support levels;
– analysing trend stability;
– confirming market signals.
Parameters such as the opening and closing price of a position and the minimum and maximum value of an asset are involved in the formation of the index.
ASI is a universal tool that can track the most important market signals. This specificity allows it to cover a wide range of trading purposes, making the index popular among traders. The indicator is most often used to determine current market trends. The tool allows you to highlight the most stable changes that can become part of a trading strategy. ASI helps analyse breakdowns and reduce the likelihood of false signals that distort the overall picture.
Advantages and disadvantages
The index provides information about changes in the trend. At the same time, its indicators may differ from the price dynamics. If the price of the asset rises and the indicator falls, the market’s momentum will decrease.
Analysts highlight the following advantages of the strategy using this tool:
1. Accuracy: in combination with additional technical analysis tools, ASI predicts significant changes with a high degree of accuracy.
2. Versatility: the index can be used for a variety of assets and time intervals.
3. Risk minimisation: ASI allows you to set stop-loss and take-profit at the right levels. This protects the trader from large losses.
Like any other tool, ASI has its disadvantages:
1. Correction of false breakdowns is possible. The indicator may give signals that, at first glance, appear to confirm the trend. However, in practice, they may turn out to be false. This risk is likely to occur with small price fluctuations.
2. The need to use additional tools. Most traders use the ASI together with the EMA or RSI. This approach helps to reduce the probability of error.
3. It is quite complicated to use and interpret. Basic knowledge of technical analysis is necessary to work with the indicator.
In addition, the indicator is not effective enough during flat periods. When a sideways trend dominates, the tool’s accuracy may decrease.
The accumulative index is useful for analysing the market’s overall picture. However, additional indicators are better for a more in-depth study of short-term trends.


