
How to use the True Strength Index in a trading strategy
The True Strength Index (TSI) is a tool used to evaluate the strength of a trend. It analyses market momentum and direction to identify potentially successful entry and exit points.
The indicator is based on two exponential moving averages, which smooth the data and reduce the influence of market noise. This improves the accuracy of the signals, making the TSI a useful tool for short-term and long-term trading strategies alike.
If the TSI is above zero, it is said to indicate a bull market trend. Below this level, the signal indicates bearish dominance. Another useful feature of the indicator is its ability to identify overbought and oversold trends. This information can be useful when studying the probability of a trend reversal.
TSI can help traders study impulses in the value of assets. This provides a solid foundation for developing a long-term trading strategy.
When the signal line crosses from the bottom to the top, it indicates the beginning of a bullish trend. In this case, traders start working with long positions. Conversely, when the line is crossed from top to bottom, they start selling assets. Generally, crossings indicate a sharp change in market dynamics. This increases the effectiveness of short-term strategies. By tracking the lines, you can adapt your actions to specific conditions.
However, it is important to take into account the possible divergence between the direction of price movement and the indicator itself. Such divergence may indicate a weakening of the current trend. But it is recommended that you use additional analytical tools to confirm these signals.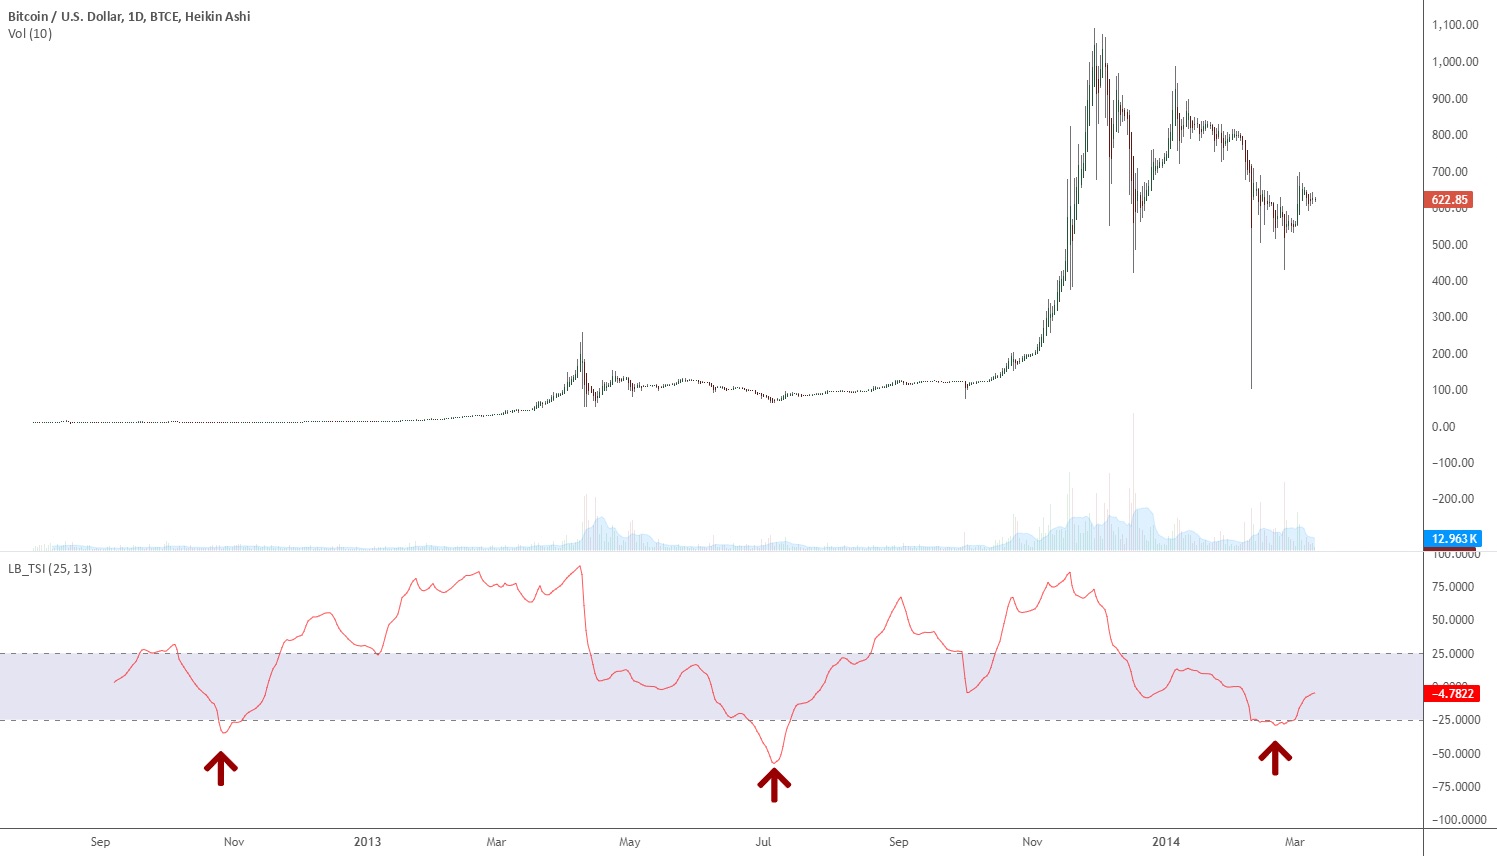
Advantages and disadvantages of True Strength Index
Like any other technical analysis tool, TSI has its strengths and weaknesses.
Advantages of the indicator:
– TSI demonstrates high accuracy when using a long-term trading approach.
– it takes into account not only the strength of the trend but also the power of the impulse during analysis.
– TSI is easy to use in combination with other technical analysis indicators and is integrated with various tools.
– it demonstrates high accuracy in the event of a strong trend.
– the index searches for entry and exit points thanks to the signal and centre lines.
As for the disadvantages, they are as follows:
– in conditions of market consolidation, there is a high risk of false signals.
– for each financial instrument, it is necessary to adjust the indicator for specific parameters;
– there is a probability of signal lag in the event of a trend reversal.
– low market volatility can reduce accuracy.
The risk of false signals increases during periods of low market activity. To avoid losses, experts recommend using the indicator alongside other tools. It is also significant to assess the market situation as a whole and monitor general sentiment and trends.