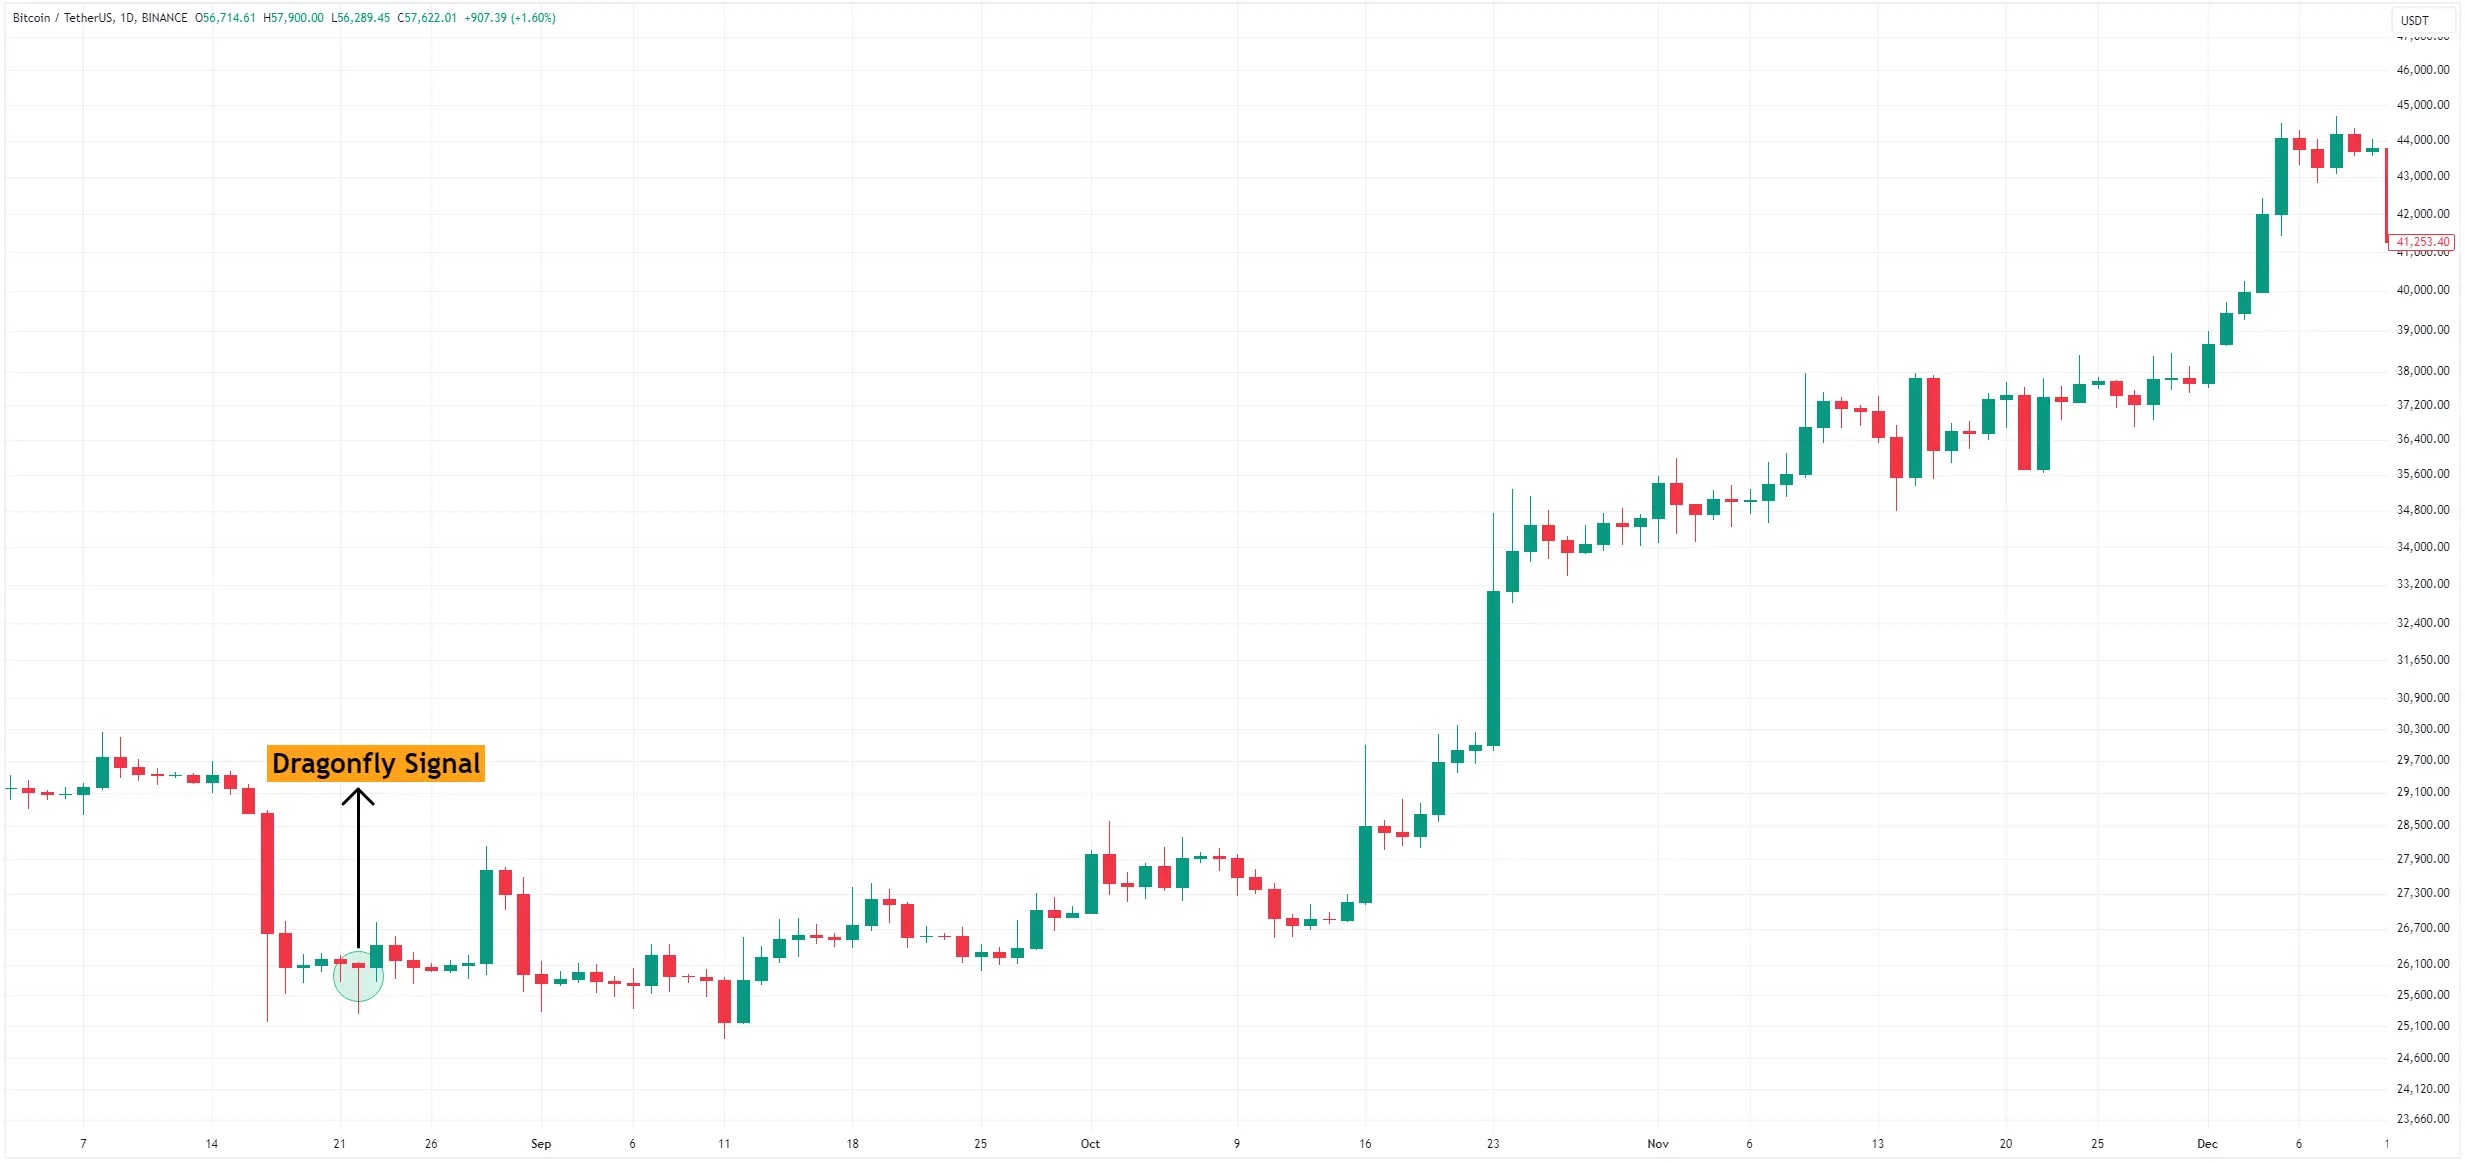
In what strategies the Dragonfly Doji is used
One of the most common price chart patterns is the Japanese doji candlestick. They come in a huge number of varieties and modifications and often indicate uncertainty in the market. However, the dragonfly doji deserves special attention due to its unusual nature.
This pattern is peculiar because it has no candle body. In some cases, it is very small. In addition, there is no upper shadow, and the lower shadow is long.
When this pattern appears, it indicates a turning point. If it was up before, it is time for a downtrend and vice versa. The influence of the candlestick is considered to be strongest after the action of a downtrend for a long time. When the doji appears at the base of the chart, it is seen as a strong sign of an upward price change. When a doji appears after an uptrend, traders should expect the bullish momentum to weaken.
The lower shadow of the candlestick indicates aggressive selling that occurred during the figure’s formation.
Pros and cons of the pattern
The dragonfly rarely appears on the chart, but it immediately attracts the traders’ attention. At the same time, the following trading conditions are characteristic of the doji:
– opening a trade occurs after the figure is complete;
– the stop-loss is set slightly below the minimum price.
Despite the relatively simple conditions and interpretation of the candlestick’s appearance, it has a number of disadvantages:
– the signals it gives can be unreliable;
– the interpretation of the candlestick should take into account the general market sentiment;
– a strong signal is found only in the change of dynamics after a long trend influence;
– rarely appears on the chart.
The use of doji should be in conjunction with the use of additional indicators. In this way, the trader will be able to minimise errors and false candlestick signals. At the same time, the pattern can be considered a tool for working in different markets. Dragonfly will be suitable for analysing commodities, as well as the forex and crypto markets.
In which strategies is it used?
The most popular use of the ‘dragonfly’ candlestick is in connection with scalping. This strategy involves trading operations during the day on timeframes of 3 to 5 minutes. When opening multiple trades, the doji is also suitable for day trading. The time range is from 15 minutes to one hour.
The Dragonfly also performs well when used in medium-term strategies. In this case, transactions may remain open for days or weeks. The recommended timeframes for analysis range from H1 to D1.
A number of traders choose a pattern for their investment activity, which can last from one month to several years.
In any case, it is important to check the reliability of the signal with additional technical indicators.


